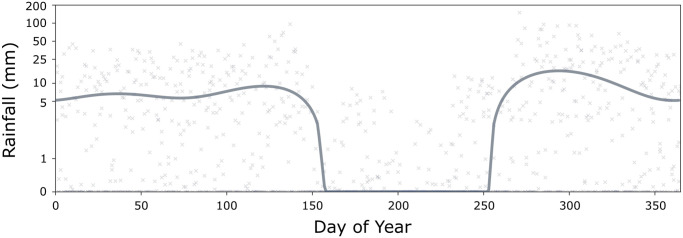
Fig 2. Seasonal rainfall profile for São Tomé and Príncipe.
Points represent mean daily rainfall measurements (in mm) for the three years between January 1st, 2017 and December 31st, 2019. The solid line represents the seasonal rainfall profile, fitted using the umbrella [30] package in R, used to calculate the time-varying environmental carrying capacity for larvae in the life history module of MGDrivE 3.

