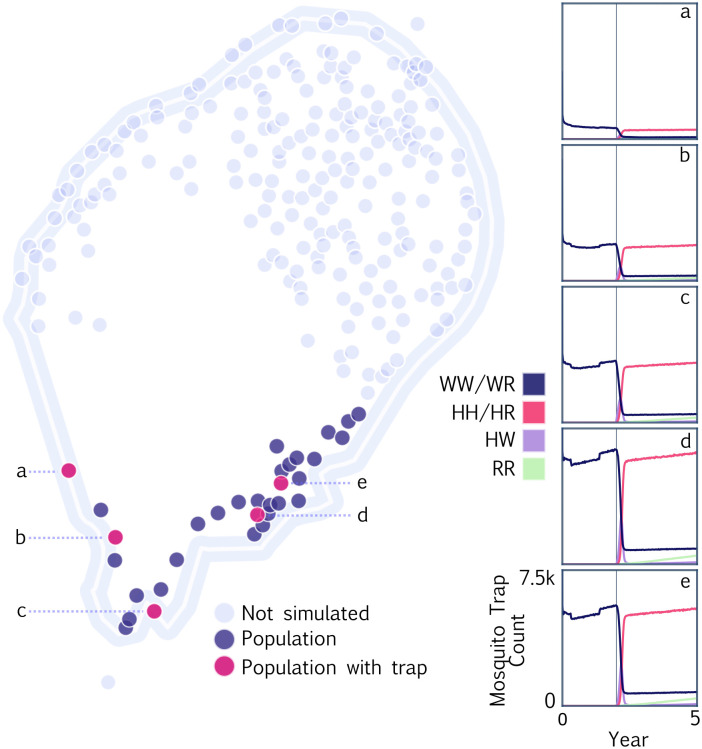
Fig 4. Example MGDrivE 3 simulations for spatial surveillance of a full gene drive system on the island of São Tomé, São Tomé and Príncipe.
Mosquito population nodes represent villages and suburbs of comparable size with mosquito movement probabilities between localities derived from an ecology-motivated algorithm [42] and calibrated to mark-release-recapture data [43, 44]. Simulation was restricted to the southern portion of the island, with population nodes including traps depicted in pink and other population nodes depicted in blue. Traps were placed using the MGSurvE framework [32]. Eight weekly releases of a full gene drive system (cutting rate of 1.0 and homology-directed repair rate of 0.99) were simulated in the southernmost population node of the island, and the phenotype distribution of trapped mosquitoes is depicted for the five trap nodes in panels a-e. Vertical lines denote the time of first transgene detection for each trap.

