
FIG 1.
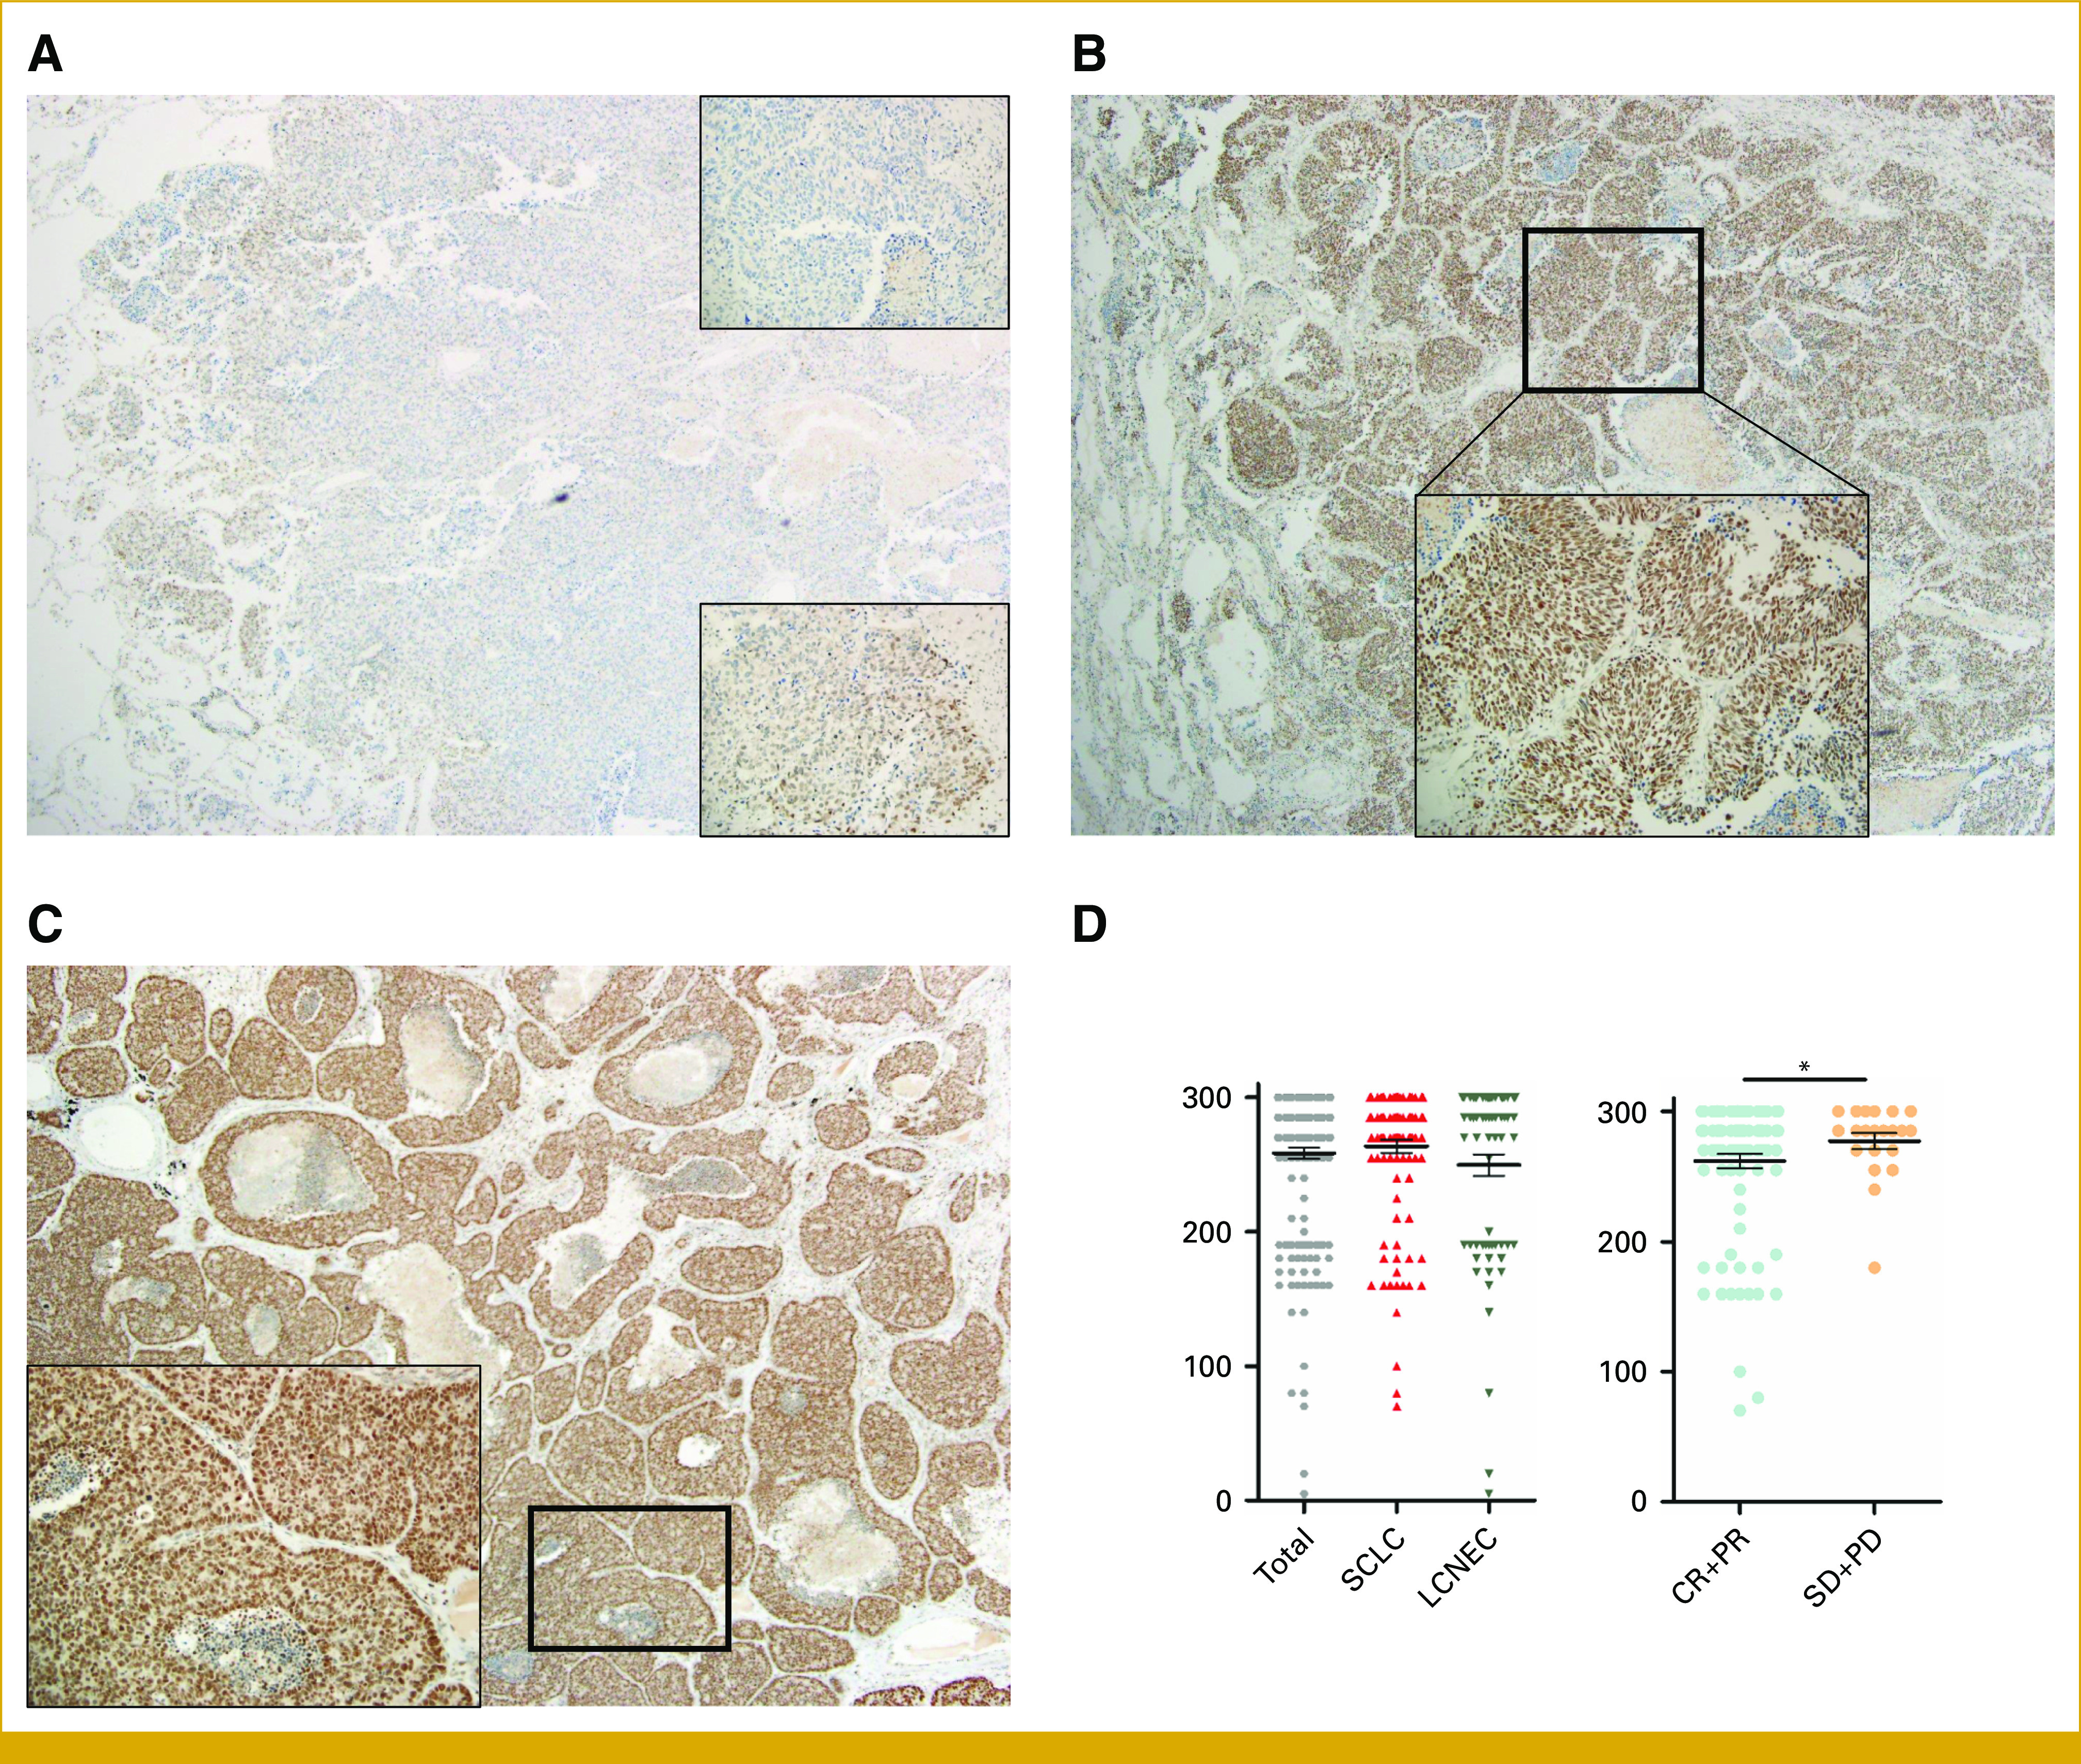
Expression of PARP1 immunohistochemistry. (A) Intensity 1, extent 5%, ×40 (upper right, ×200). No PARP1 expression in tumor compared with internal control (positively stained lymphocytes; lower right, ×200) focal area of PARP1 expressing tumors with intensity 1. (B) Intensity 2, extent 95%, ×40 (right, ×200) strong PARP1 expression in most tumor cells, but the intensity is lower than internal control (positively stained lymphocytes). (C) Intensity 3, extent 100%, ×40 (right, ×200) strong PARP1 expression in all tumor cells, the intensity is same or slightly lower than internal control (positively stained lymphocytes). (D) Scatter dot plots showing PARP1 score by histology (left) and response to chemotherapy (right). * P < .05. CR, complete response; LCNEC, large cell neuroendocrine carcinoma; PARP1, poly (ADP-ribose) polymerase-1; PD, progressive disease; PR, partial response; SCLC, small cell lung cancer; SD, stable disease.