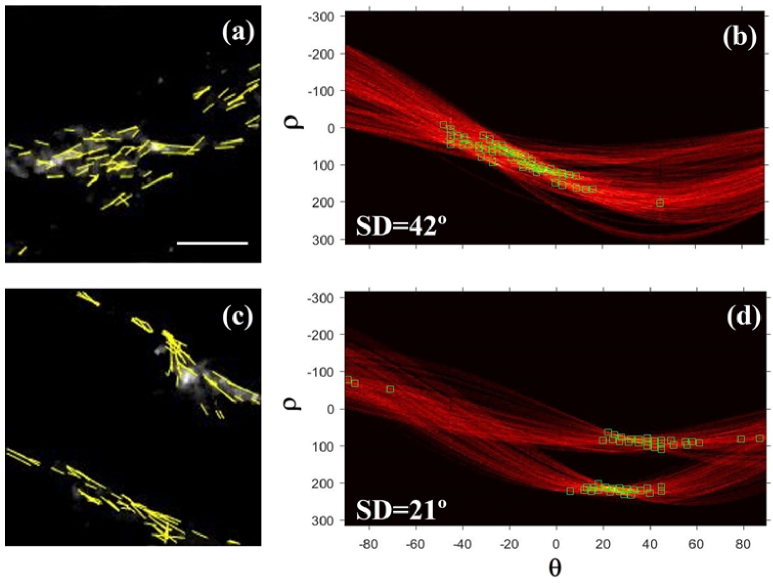
Fig. 10.
SHG images of the interstitial collagen in a young (a) and an old sample (c). Overlapped yellow lines represent the lines detected by the HT algorithm. (b, d) Corresponding HT accumulation matrices for both images. Green boxes indicate the orientation of the lines detected within the images. Bar length: 50 µm.

