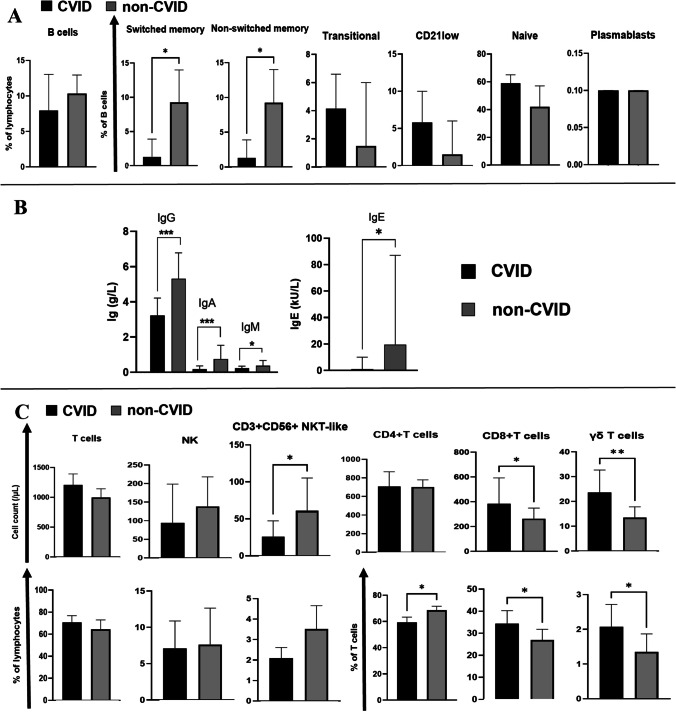
Fig. 2.
A Comparison of peripheral B-cell subset phenotypes between CVID and non-CVID humoral immunodeficiency (hID) patients. Black bars and gray bars indicate respectively CVID and non-CVID hID populations. B cell (CD19+ lymphocytes) subests are defined as follow: switched memory B cells = CD27 + CD21 + CD38 + IgM-IgD-; non-switched memory B cells = CD27+CD21+CD38+IgM++IgD+; CD21low B cells = CD27−CD21lowCD38lowIgM+IgD+; Naïve B cells: CD27−CD21+CD38+IgM+IgD++; Transitional B cells: CD27−CD21+CD38++IgM++IgD++; Plasmablasts: CD27++CD21+CD38+++IgD− B IgG values at onset and IgA, IgM and IgE values at last evaluation are compared between CVID (black bars) and non-CVID hID (gray bars) patients. C. Comparison of lymphoid cell populations (T-cells: total, CD4 + , CD8 + , g/d; NK-cells; NKT-like cells) between CVID and non-CVID hID patients. Black bars and gray bars indicate respectively CVID and non-CVID hID populations. The respective lymphoid population are indicated upon each column. Absolute and percentage count are represented respectively in the first and second raw. The histograms show the medians with 95% CI. P values are based on Mann–Whitney U test (p < 0,05:*; p < 0,01:**; p < 0,001:***). Abbreviations: Lymph.: lymphocytes

