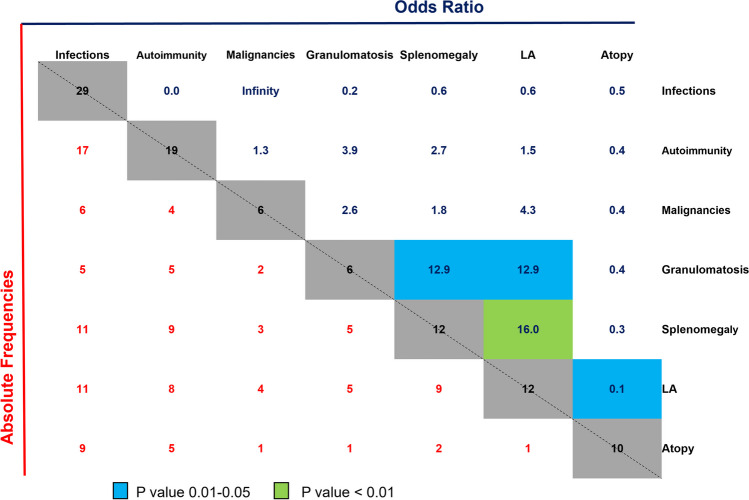
Fig. 3.
Features of clinical presentation of CVID patients with absolute frequencies and the relative odds ratio of the probability of their occurrences. Numbers in the lower left triangle (red text) indicate the absolute frequencies of occurrence/co-occurrence of symptoms among all CVID patients. Numbers in the upper right triangle (blue text) show the odds ratio for the probability of occurrence of the combined phenotypes. Significant associations are color-coded according to the legend (p values were based on two-sided Fisher’s exact test). Abbreviations: LA: lymphadenopathy

