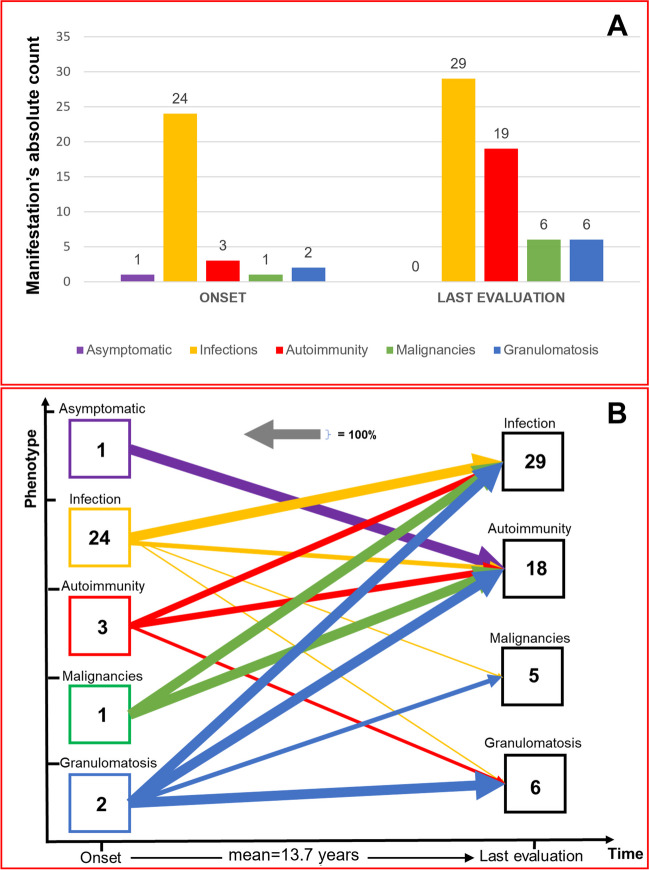
Fig. 4.
A Clinical phenotypes in CVID: onset vs. last clinical evaluation. Values represent the absolute patient count for each specific manifestation. B Evolution of clinical phenotypes over time. This graph illustrates the progression of clinical manifestations from onset to the last visit. “Onset” indicates syndrome which were present at first evaluation. “Last evaluation” indicates add-on syndromes to the one in “onset”. Onset manifestations, if limited on time or controlled by therapy (e.g., resolved neoplasm, autoimmune disease without further exacerbations, single infectious episode), are not considered among the manifestations at the last assessment. The thickness of each line indicates the percentage of patients who developed the condition indicated by the arrow, respect to the baseline (“onset”) number. For instance, the purple arrow for asymptomatic patients (1 individual) represents 100% because 1 out of 1 patient (hence, 100%) displayed an autoimmune phenotype during the last assessment. It is possible that the sum of the percentages of arrows of the same colour exceeds 100%, as the same patient may have presented different clinical manifestations. The numbers within the boxes represent the absolute number of patients who exhibited that specific manifestation in that specific time

