Fig. 6.
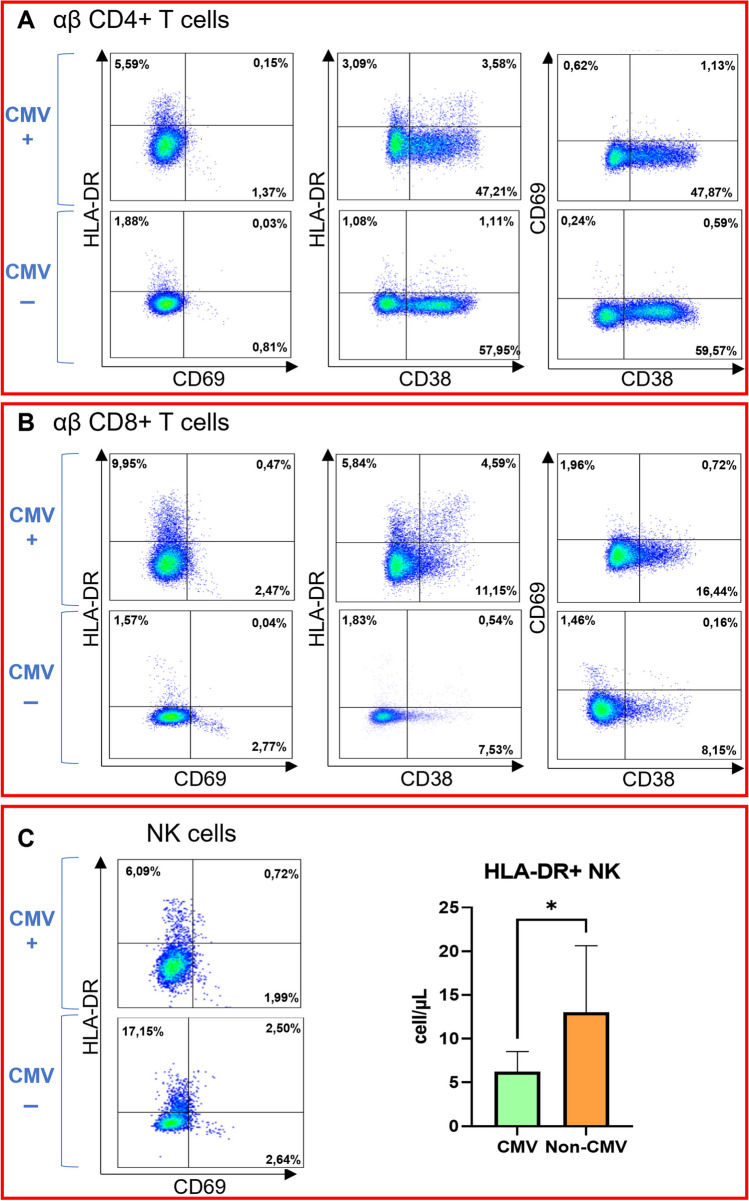
HLA-DR, CD38 and CD69 expression on T subsets and NK-cells. A Dot plots illustrate activation marker expression on CD4 + T-cells of both a CVID patient with CMV-only viraemia (CMV +) and a CVID patient without viraemia (CMV -). B Dot plots illustrate activation marker expression on CD8 + T-cells of both a CVID patient with CMV-only viraemia (CMV +) and a CVID patient without viraemia (CMV -). C. Dot plots illustrate HLA-DR and CD69 expression on NK-cells of both a CVID patient with CMV-only viraemia (CMV +) and a CVID patient without viraemia (CMV -). In the column bar graph, HLA-DR + NK-cell count between patients with active ( +) and absent (-) CMV replication was compared. The histograms represent the medians with CI 95%. P values are based on two-tailed Mann–Whitney U test (p < 0,05:*)

