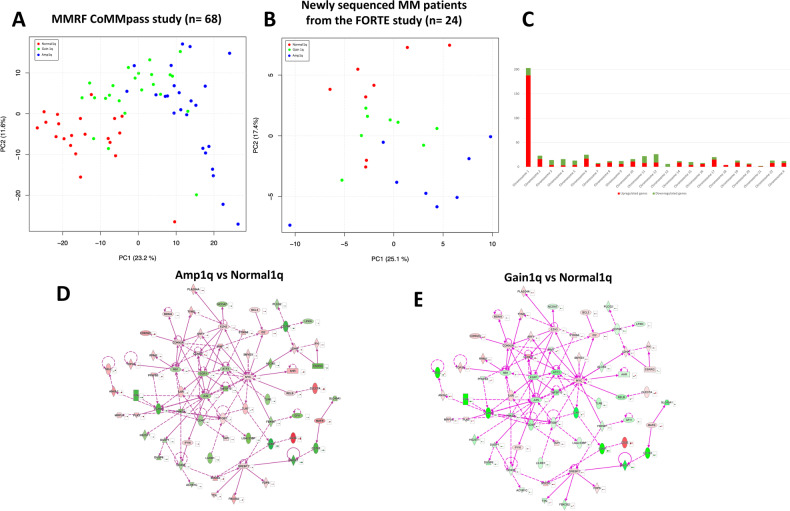
Fig. 5. Transcriptomic deregulation according to 1q copies.
Principal component analysis using RNAseq data was able to separate NDMM patients according to 1q copy numbers in the MMRF CoMMpass study (A). The separation was maintained when applied to a validation cohort of newly sequenced NDMM patients from the FORTE trial (B). Number of differentially expressed genes divided according to chromosome number are presented in Panel C. Ingenuity Pathway connectivity analysis of differentially expressed genes in Amp1q vs. Normal1q (D) and Gain1q vs. Normal1q (E) shows a deregulated gene network centered on Myc. Green color indicates down-regulation and red color up-regulation.

