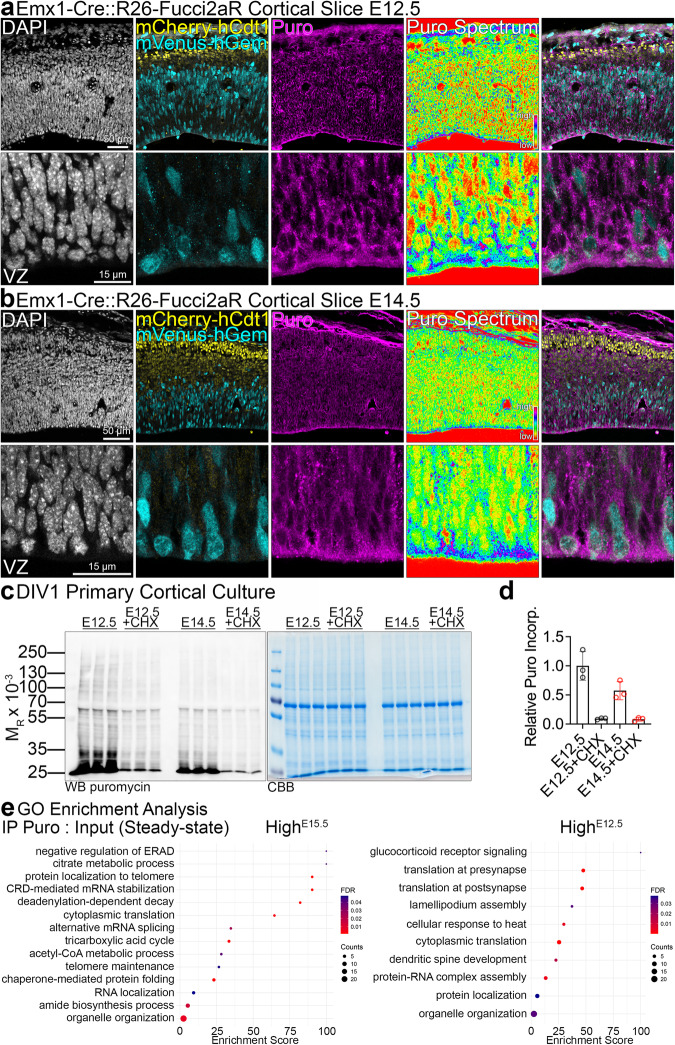
Fig. 3. The translatome of early and late cortical lineages.
a, b Representative images of anti-puromycin (Puro) immunolabeled slice cultures from E12.5 and E14.5 cortices. Panels labeled Puro Spectrum are intensity encoding renderings of Puro incorporation. Ventricular zone, VZ. The slice culture experiment was repeated three times with similar Puro labeling pattern. c, d Anti-puromycin Western blotting in E12.5 or E14.5 primary cortical cultures at DIV1, pulsed with puromycin and treated with CHX, and Puro incorporation quantification. CBB, Coomassie Brilliant Blue stain to visualize proteins in SDS-PAGE gels. e Summary of GO enrichment analysis based on the normalized abundance of identified proteins in the IP fraction in E15.5 and E12.5 cultures. Refer to Supplementary Data S2 for a full dataset and to Data Availability section for the information on data deposition. Bar graphs show individual data points and averages ± S.D. For statistics on (d), D’Agostino-Pearson normality test and Kruskal-Wallis test with Dunn’s multiple comparisons test, n = 3 biological replicates per each condition.

