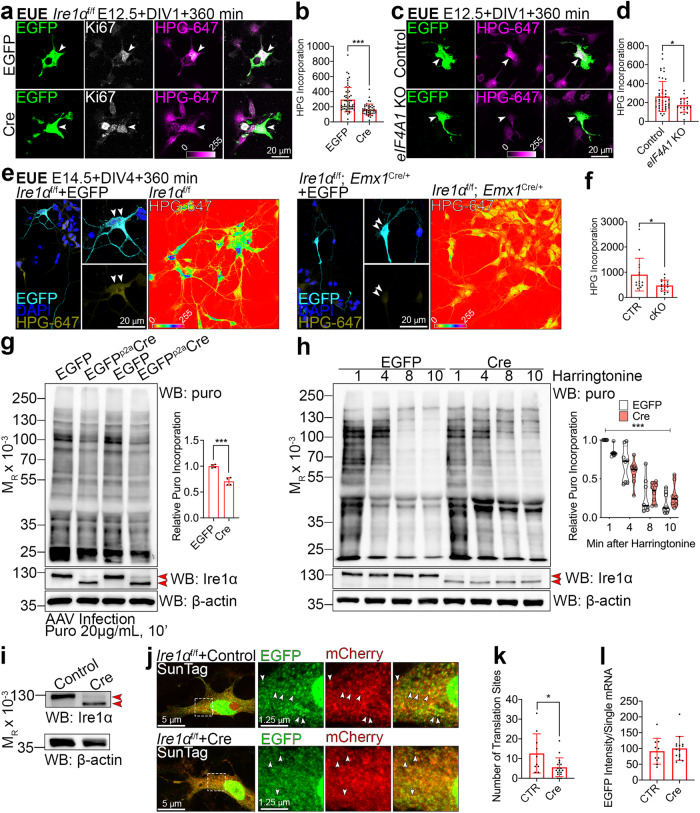
Fig. 8. Loss of Ire1α leads to diminished translation rates as an effect of slower elongating ribosomes and fewer translation sites.
a, c, e Images of representative primary cortical neurons prepared from Ire1αf/f a wild-type c or control and Ire1α cKO e embryos after ex utero electroporation (EUE) at E12.5 (a and c) or E14.5 e with indicated plasmids. Neurons were fed L-homopropargylglycine (HPG) for 360 min prior to fixation at DIV1 or DIV4. HPG was detected with Sulfo-Cyanine5 azide. e Right panels: images of HPG incorporation in control and cKO primary DIV4 neurons prepared from E14.5 cortex. White arrowheads point to Ki67-positive progenitors (a and c) or to somata of neurons derived from E14.5 progenitors (e). b, d, f Quantification of HPG incorporation. g Representative Western blotting using DIV5 lysates from Ire1αf/f mouse embryonic fibroblasts (MEFs) after metabolic labeling of protein synthesis using puromycin (puro) and its quantification. MEFs were infected at DIV0 with control or Cre-expressing AAVs. Red arrowheads point to wild-type and KO form of Ire1α. h Representative Western blotting results of ribosome run-off assay using puromycin in control and KO MEFs at indicated timepoints after harringtonine treatment and quantification. i Western blotting validation of Ire1α KO in AAV-infected MEFs for the SunTag reporter experiment. j Representative images of empty and Cre-encoding virus infected MEFs expressing the SunTag24x-BFP-PP7 reporter. k Active translation sites were quantified in fixed MEFs. l Quantification of the intensity of scFv-GFP at translation sites. Bar graphs represent data points and averages ± S.D. Violin plot on h represents individual data points, thick line median and thin lines quartiles. Statistics for b, d, f, k, l D’Agostino-Pearson normality test; for b Mann-Whitney test, ncells for EGFP = 58 and for Cre = 42 from three independent cultures, p < 0.0001; d Mann–Whitney test, ncells for Control=54 and for Cre=21 from three independent cultures, p = 0.0291; f Mann-Whitney test, ncells for EGFP = 15 and for Cre=19 from three independent cultures, p = 0.0169; g Shapiro-Wilk and unpaired t-test, four independent cultures, p = 0.0003; h two-way ANOVA with Bonferroni multiple comparisons test, eight independent experiments, p < 0.0001; k Mann–Whitney test, ncells for CTR = 10 and for Cre=17 from three independent cultures, p = 0.0438; l unpaired t-test, ncells for CTR = 10 and for Cre=15 from three independent cultures, p = 0.58. Statistical tests were two-sided. 0.01 <* p < 0.05; *** p < 0.001.

