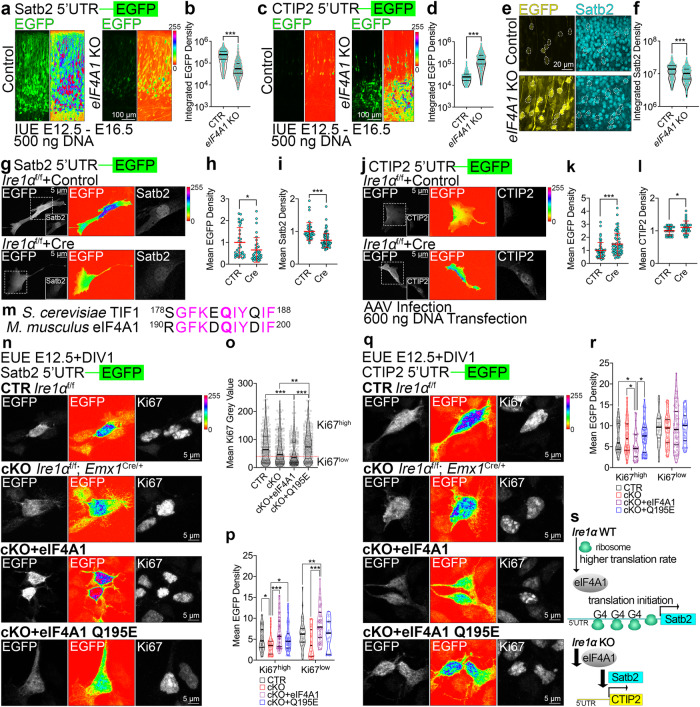
Fig. 9. Helicase activity of eIF4A1 and Ire1α are indispensable for translation of Satb2 in cortical lineages.
a, c Representative images of EGFP fluorescence signals in the E16.5 brain sections after IUE at E12.5 with CRISPR-Cas9 vectors to achieve indicated genotypes and Satb2 5’UTR a or CTIP2 5’UTR c translation reporter construct. Shown are the native signals (left panels) and intensity encoding (right panels). b, d Quantification of EGFP fluorescence signals in single cells expressing translation reporters of Satb2 5’UTR b or CTIP2 d. e, f Representative images and quantification of CTIP2 5’UTR translation reporter construct and anti-Satb2 immunolabeling (compare c, d). g–l Representative images of EGFP fluorescence signals (left panels: gray scale, middle panels: intensity encoding) and immunostaining for Satb2 g or CTIP2 j in Ire1αf/f MEFs infected with Control or Cre-encoding AAVs at DIV0. At DIV5, infected MEFs were transfected with indicated reporter constructs, fixed and immunostained at DIV6. h, k Quantification of EGFP mean fluorescence signals of 5’UTR Satb2 reporter h or CTIP2 (k). i, l Quantification of mean nuclear fluorescence signals after immunostaining for Satb2 i or CTIP2 (l). m Sequence alignment of yeast TIF1 and murine eIF4A1. In bold the Q residue crucial for helicase activity. n–r Early cortical progenitors of indicated genotypes were transfected with EUE with Satb2 n or CTIP2 q translational reporter, as well as indicated constructs. At DIV1, cells were fixed and immunolabeled against EGFP and Ki67. o Quantification of overall Ki67 fluorescence intensity in analyzed cells. p, r Quantification of translational reporter fluorescence in Ki67 expression level-dependent manner. s Current model of Ire1α and eIF4A1 interplay in regulation of neuronal cell diversity in the cortex. Violin plots depict median, interquartile range (box) and minimum and maximum value (whiskers). Red line and error bars on h, i, k, l indicate mean ± S.D. For statistical analyses, b, d, f, h,i, k, l D’Agostino and Pearson normality test and Mann-Whitney test; o, p, r D’Agostino and Pearson normality test and Kruskal-Wallis test with Dunn’s correction. For b, d, f p < 0.0001; for exact p values in o, p, r refer to Supplementary Fig. 1. For h ncells for CTR = 33 and for Cre = 35, p = 0.0105; i ncells for CTR = 39 and for Cre = 85, p < 0.0001; k ncells for CTR = 53 and for Cre = 58, p = 0.0003; l ncells for CTR = 30 and for Cre = 30, p = 0.0388. Results on h-i and k-l represent quantifications from three independent cultures. Statistical tests were two-sided. 0.01 <* p < 0.05; 0.001 <** p < 0.01; *** p < 0.001.

