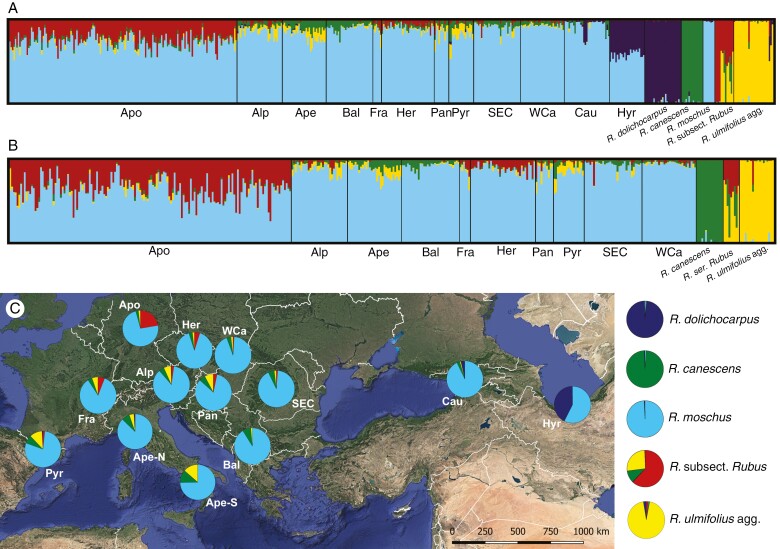
Fig. 5.
Population inference from Structure based on the Basic sample set (A, C; 7329 unlinked SNPs; K = 5) and the European set (B; 7596 unlinked SNPs; K = 4) visualized as bar charts for each individual (A, B) and pie charts with individual assignment probabilities averaged for each population or taxon (C). The pie charts in C are shown on the map of Europe and West Asia for each population (note that the Ape population has been split here into northern and southern subpopulations to show population subdivision), with ancestral taxa set aside. Each of the plots represents an average of ten runs (similarity score = 1.0). Rubus subsect. Rubus covers North American and European taxa (R. ser. Rubus) in this order. For the other K values, see Supplementary Data Figs S3 and S4. Background map layer: Google Earth.

