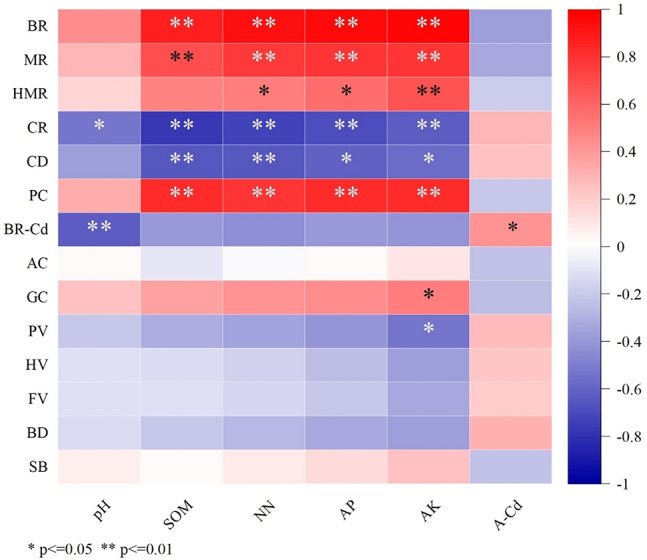
Figure 2.

Correlation analysis between soil properties and rice quality. *Significant at the 0.05 level, **Significant at the 0.01 level. SOM soil organic matter, NN alkaline hydrolysable-N, AP available phosphorus, AK available potassium, A-Cd available cadmium, BR brown rice rate, MR milled rice rate, HMR head milled rice rate, CR chalkiness rate, CD chalkiness degree, PC protein content, BR-Cd brown rice Cd content, AC amylose content, GC gel consistency, PV peak viscosity, HV hot paste viscosity, FV final viscosity, BD breakdown, SB setback.
