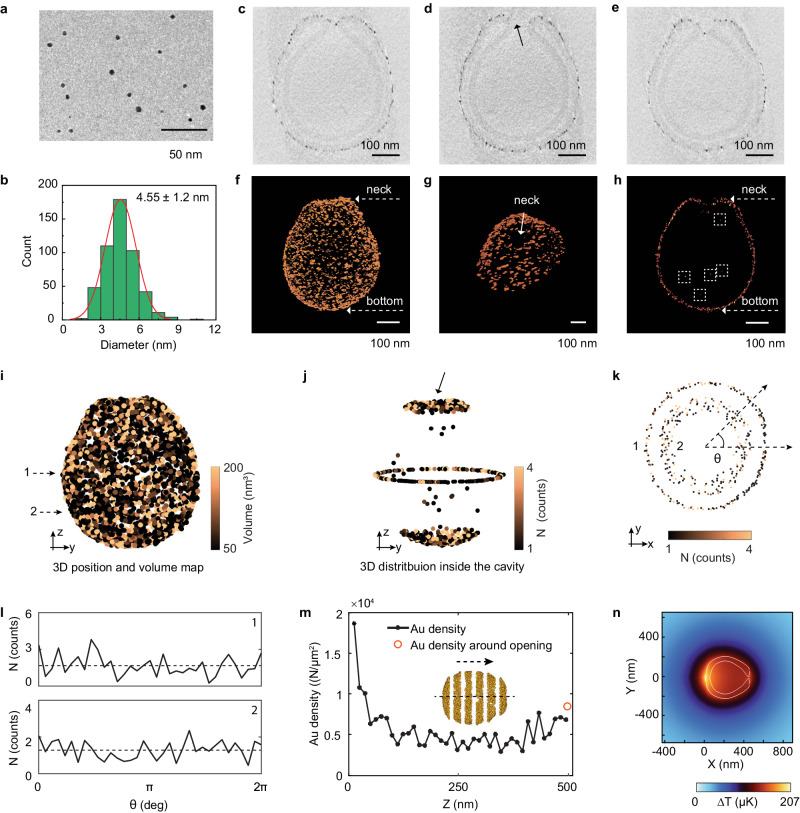
Fig. 5. Analysis of the size and spatial distribution of Au NPs by cryo-TEM and cryo-ET.
a Cryo-TEM image of as-prepared Au NPs (from the free-growth sample), 3 experiments were repeated independently with similar results, scale bar = 50 nm. b Size distribution of Au NPs coated on the stomatocytes. 500 Au NPs were measured. c−e Cross-sections of a Au-stomatocyte from cryo-ET. The arrow in d shows a Au NP trapped in the opening of the stomatocyte, 3 experiments were repeated independently with similar results, scale bar = 100 nm. f−h Volume rendering of a single Au-stomatocyte: (f) Overview; (g) Neck; (h) Cross-section showing the Au NP distribution in the neck and inside the cavity of an Au-stomatocyte (indicated with the dashed boxes), scale bar = 100 nm. i−m Quantitative analysis of the 3D Au NP distribution in a Au-stomatocyte. i 3D position and volume map of Au NPs on the outer surface of a Au-stomatocytes. j 3D distribution of Au NPs inside the cavity of a Au-stomatocyte. k 2D Au distribution from two different positions indicated by the dashed arrows. l Angular maps showing the Au NP distribution from two different cross-sections depicted in (k). m Changes in Au density along the z-axis. Inset: schematic showing how a stomatocyte is divided into several segments to estimate the Au density in each segment (see details in the Supplementary Information). The arrow indicates the moving direction of the stomatocyte under laser irradiation. n Simulated temperature distribution around a single Au stomatocyte based on the cryo-ET results (see details in the Supplementary Information).

