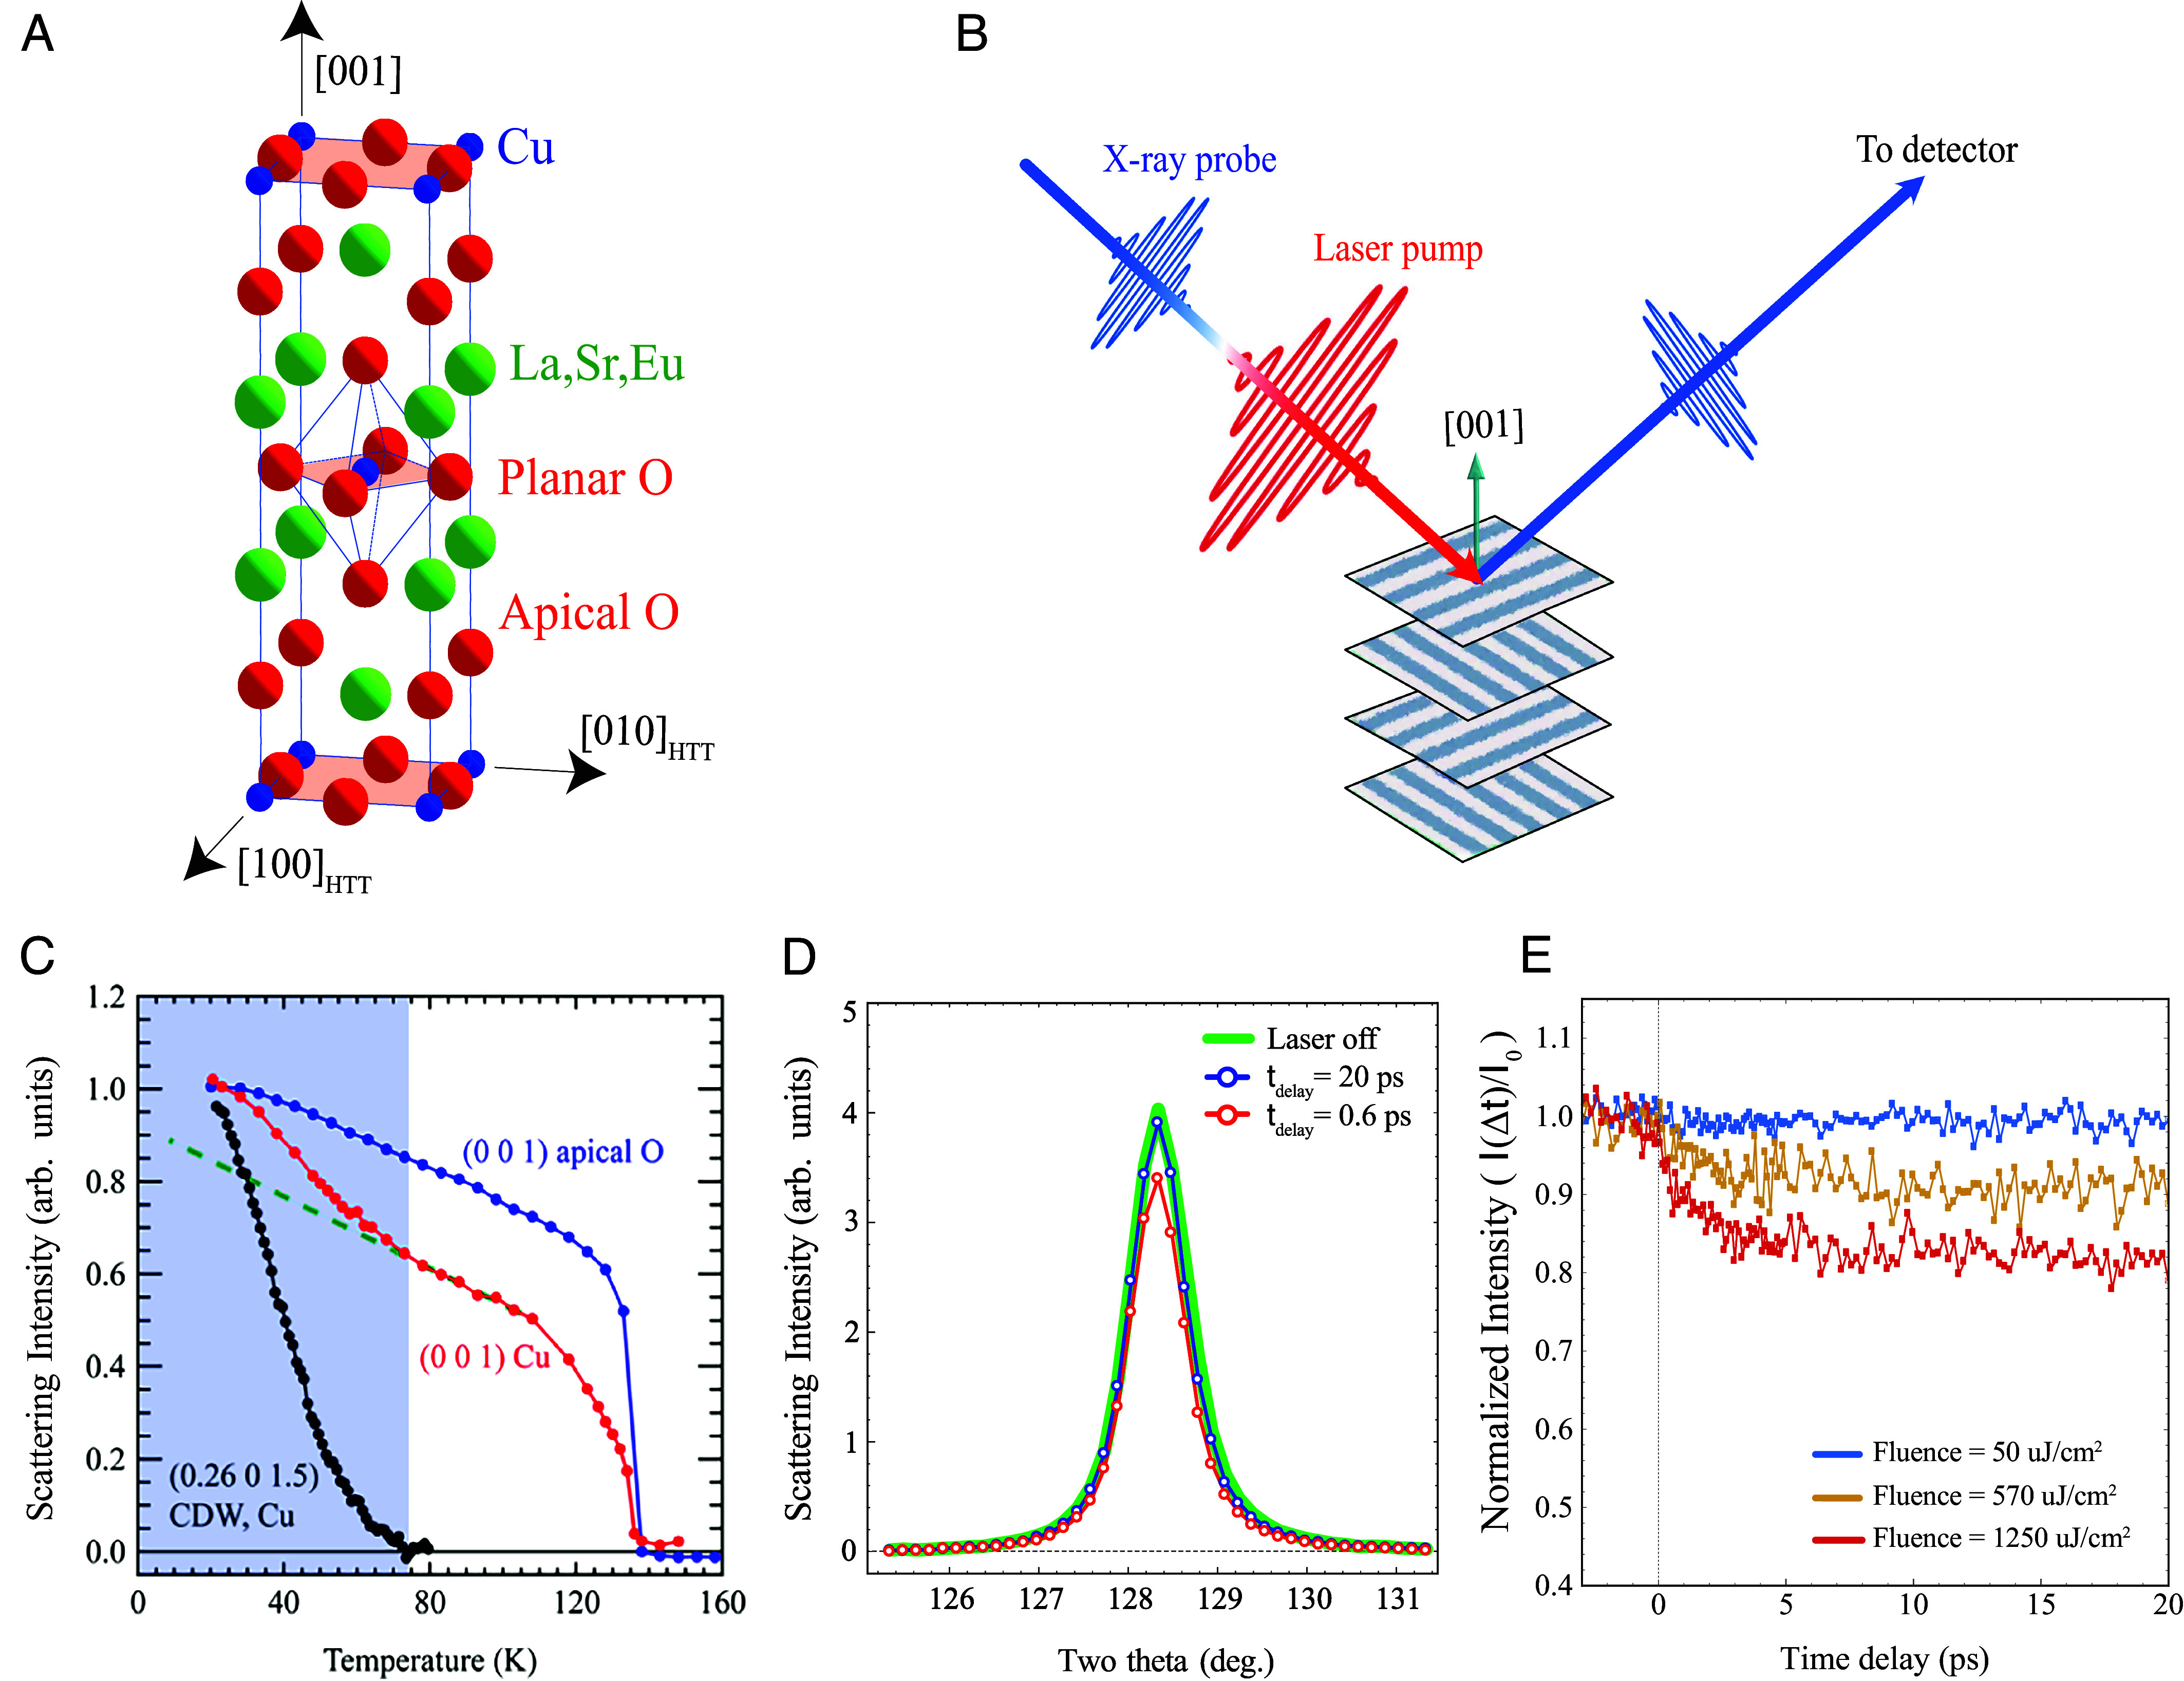
Fig. 1.

La1.65Eu0.2Sr0.15CuO4 structure, equilibrium RXS results, and tr-RXS experiment. (A) Crystal structure of LESCO. The crystal axes are labeled according to the high-temperature tetragonal (HTT) setting, and the CuO2 planes are highlighted in pale red. (B) Schematic depiction of the pump–probe geometry used to access the peak originating from the layer alternating -plane anisotropy. (C) Equilibrium temperature dependence of the apical O RXS intensity at compared with the Cu RXS intensity at and . (D) Planar O tr-RXS intensity at probed along the (0 0 ) direction in a scan. The equilibrium peak profile is compared with scans taken 0.6 ps and 20 ps after excitation with 1.55 eV pump photons at a fluence of 50 J/cm2. (E) tr-RXS intensity at the apical O resonance for at 20 K as a function of pump–probe delay. The pump–probe response is sensitive only to the anisotropy induced by the LTT structural distortion and becomes unobservable for low fluences.
