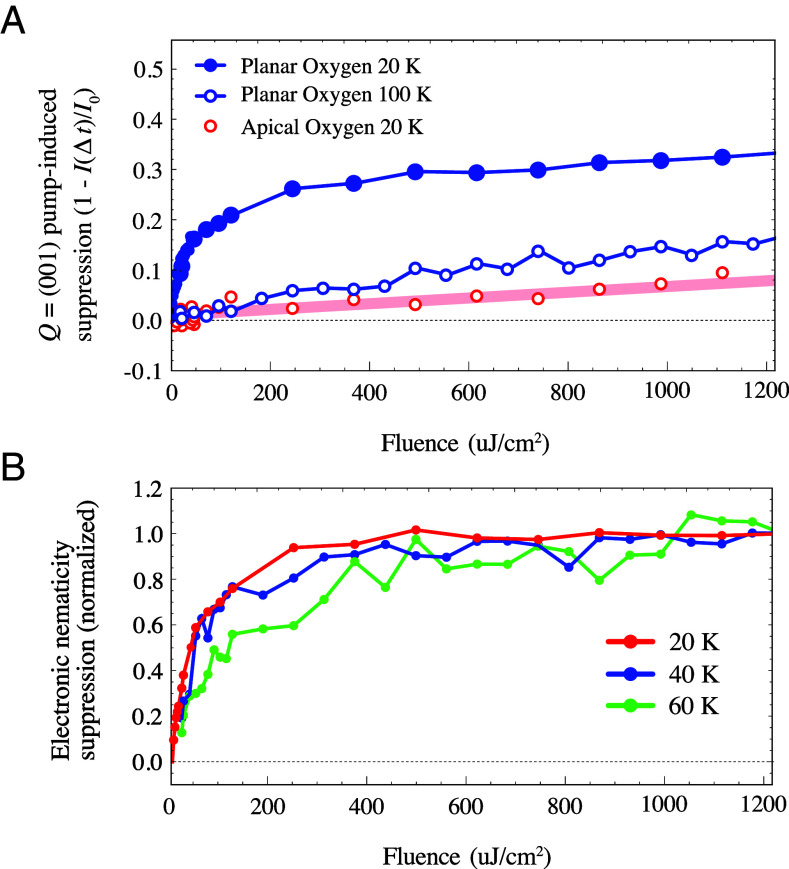
Fig. 4.
Fluence dependence. (A) Pump-induced suppression () of the O resonance tr-RXS intensity at short time delay as a function of fluence. The 20 K signal at the planar O resonance comprises both lattice and electronic contributions, while the apical resonance is sensitive only to structural anisotropy. The signal at the planar O resonance is also shown at , where its fluence dependence is qualitatively similar to that observed at the apical O resonance. The shaded red line is a linear fit to the apical O resonance data. (B) Fluence-dependent suppression of the electronic nematic signal at ps (near maximum suppression). The fluence-dependent response of the lattice is captured by a linear fit to the 20 K apical O data plotted in red in (A) and then subtracted from fluence scans collected at the planar O resonance inside the CDW phase.

