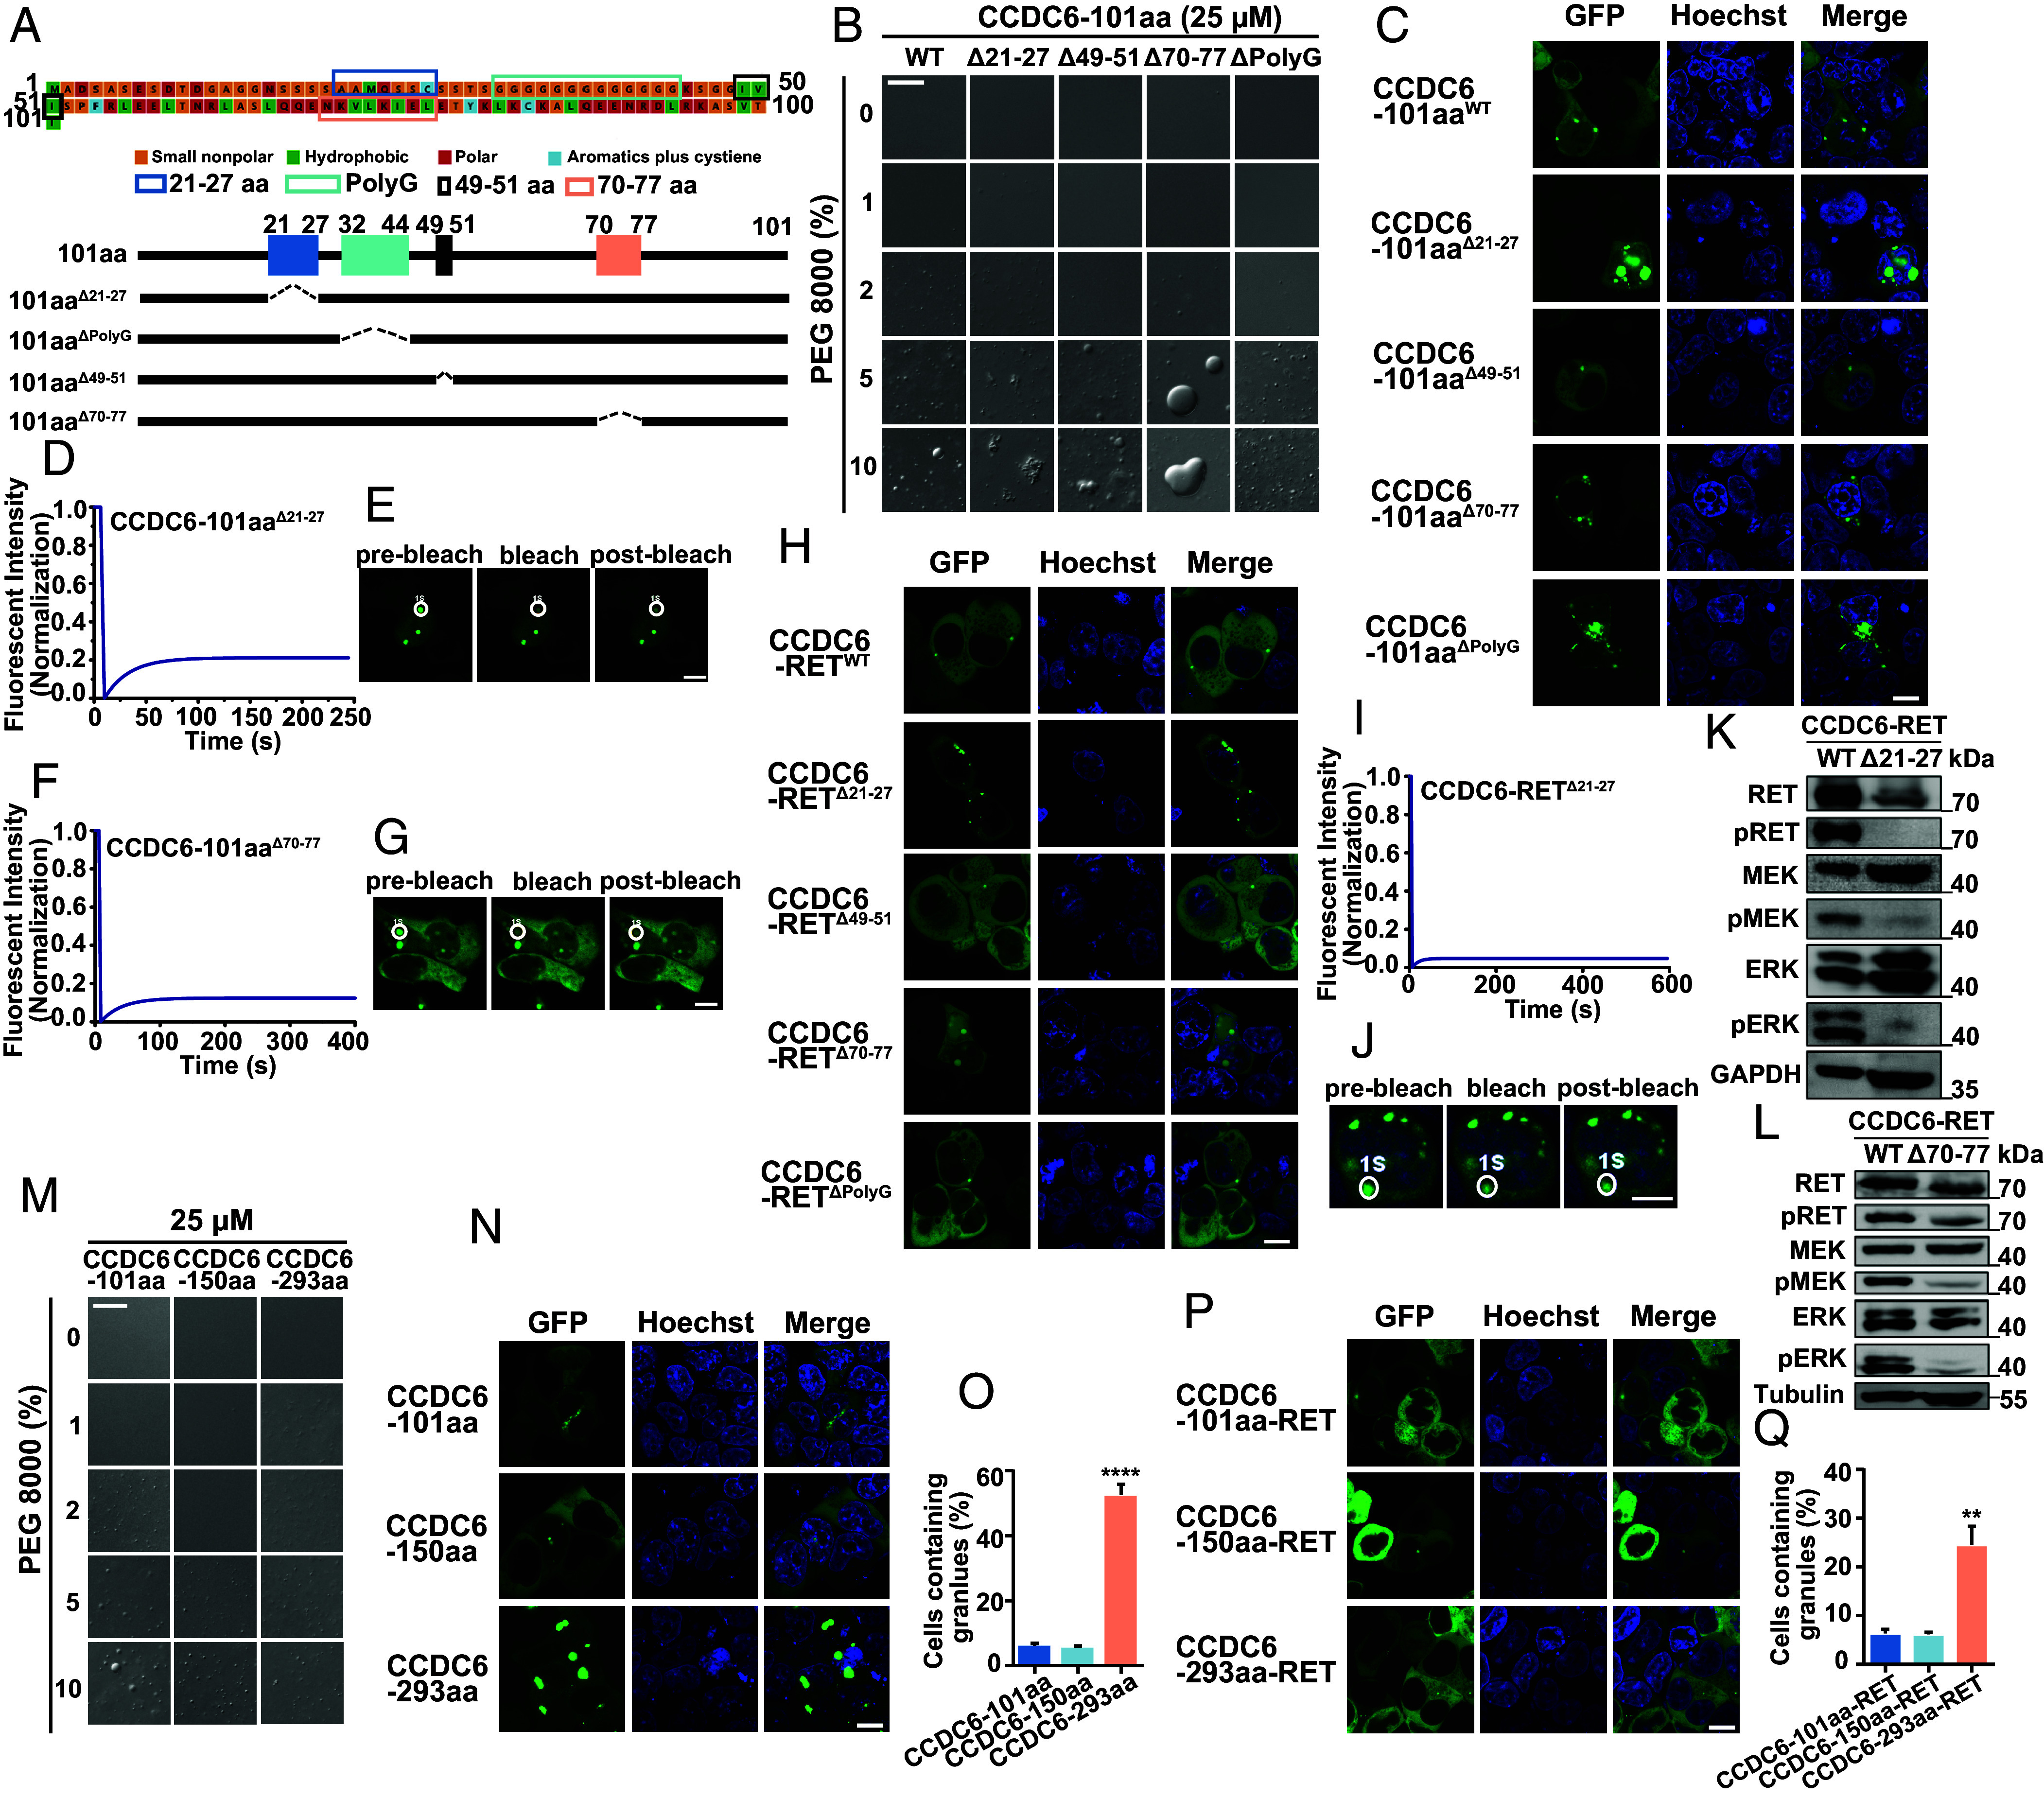
Fig. 3.

The intact IDRs of the partner are prerequisite for both LLPS and activation of the fusion protein. (A) The amino acid sequence of CCDC6-101aa is shown with major segments marked colors. (B) Comparison of the phase separation behaviors between purified recombinant mutant forms of CCDC6-101aa, including WT (wild type), Δ21-27aa, Δ49-51aa, Δ70-77aa, and ΔPloyG, with increasing concentration of PEG 8000. See also SI Appendix, Figs. S1 and S3. (Scale bar, 20 µm.) (C) Live-cell imaging of various CCDC6-101aa-EGFP mutations, including WT, Δ21-27aa, Δ49-51aa, Δ70-77aa, and ΔPloyG expressed in HEK293T, respectively, n ≥ 3. (Scale bar, 10 µm.) (D and E) FRAP of CCDC6-101aaΔ21-27-EGFP transfected in HEK293T cells. The FRAP curves are shown in D and the corresponding droplet at the bleached area in E. (Scale bar, 10 µm.) (F and G) FRAP of CCDC6-101aaΔ70-77-EGFP transfected in HEK293T cells. The FRAP curves are shown in F and the corresponding droplet at the bleached area in G. (Scale bar, 10 µm.) (H) Live-cell imaging of various CCDC6-RET-EGFP mutations, including WT, Δ21-27aa, Δ49-51aa, Δ70-77aa, and ΔPloyG expressed in HEK293T, respectively, n ≥ 3. (Scale bar, 10 µm.) (I and J) FRAP of CCDC6-RETΔ21-27-EGFP transfected in HEK293T cells. The FRAP curves are shown in I and the corresponding droplet at the bleached area in J. (Scale bar, 10 µm.) (K) Western blotting upon expression of EGFP-tagged CCDC6-RET or CCDC6-RETΔ21-27 in HEK293T cells. (L) Western blotting upon expression of EGFP-tagged CCDC6-RET or CCDC6-RETΔ70-77 in HEK293T cells. (M) Comparison of the phase separation behaviors between purified recombinant protein, containing CCDC6-101aa, CCDC6-150aa, and CCDC6-293aa, with increasing concentration of PEG 8000. See also SI Appendix, Fig. S3. (Scale bar, 20 µm.) (N) Live-cell imaging of CCDC6-101aa, CCDC6-150aa, and CCDC6-293aa expressed in HEK293T cells, respectively, n ≥ 3. (Scale bar, 10 µm.) (O) Proportion of cells with protein condensates upon transfection of CCDC6-101aa, CCDC6-150aa, and CCDC6-293aa in HEK293T cells. Error bars indicate SD from three regions in the imaged sample selected for counting, with each region containing more than 200 total cells. ****P < 0.0001 versus CCDC6-101aa by Student’s t test. (P) Live-cell imaging CCDC6-101aa-RET, CCDC6-150aa-RET, and CCDC6-293aa-RET expressed in HEK293T cells, respectively, n ≥ 3. (Scale bar, 10 µm.) (Q) Proportion of cells with protein condensates upon transfection of CCDC6-101aa-RET, CCDC6-150aa-RET, and CCDC6-293aa-RET in HEK293T cells. Error bars indicate SD from three regions in the imaged sample selected for counting, with each region containing more than 200 total cells. **P < 0.01 versus CCDC6-101aa-RET by Student’s t test.
