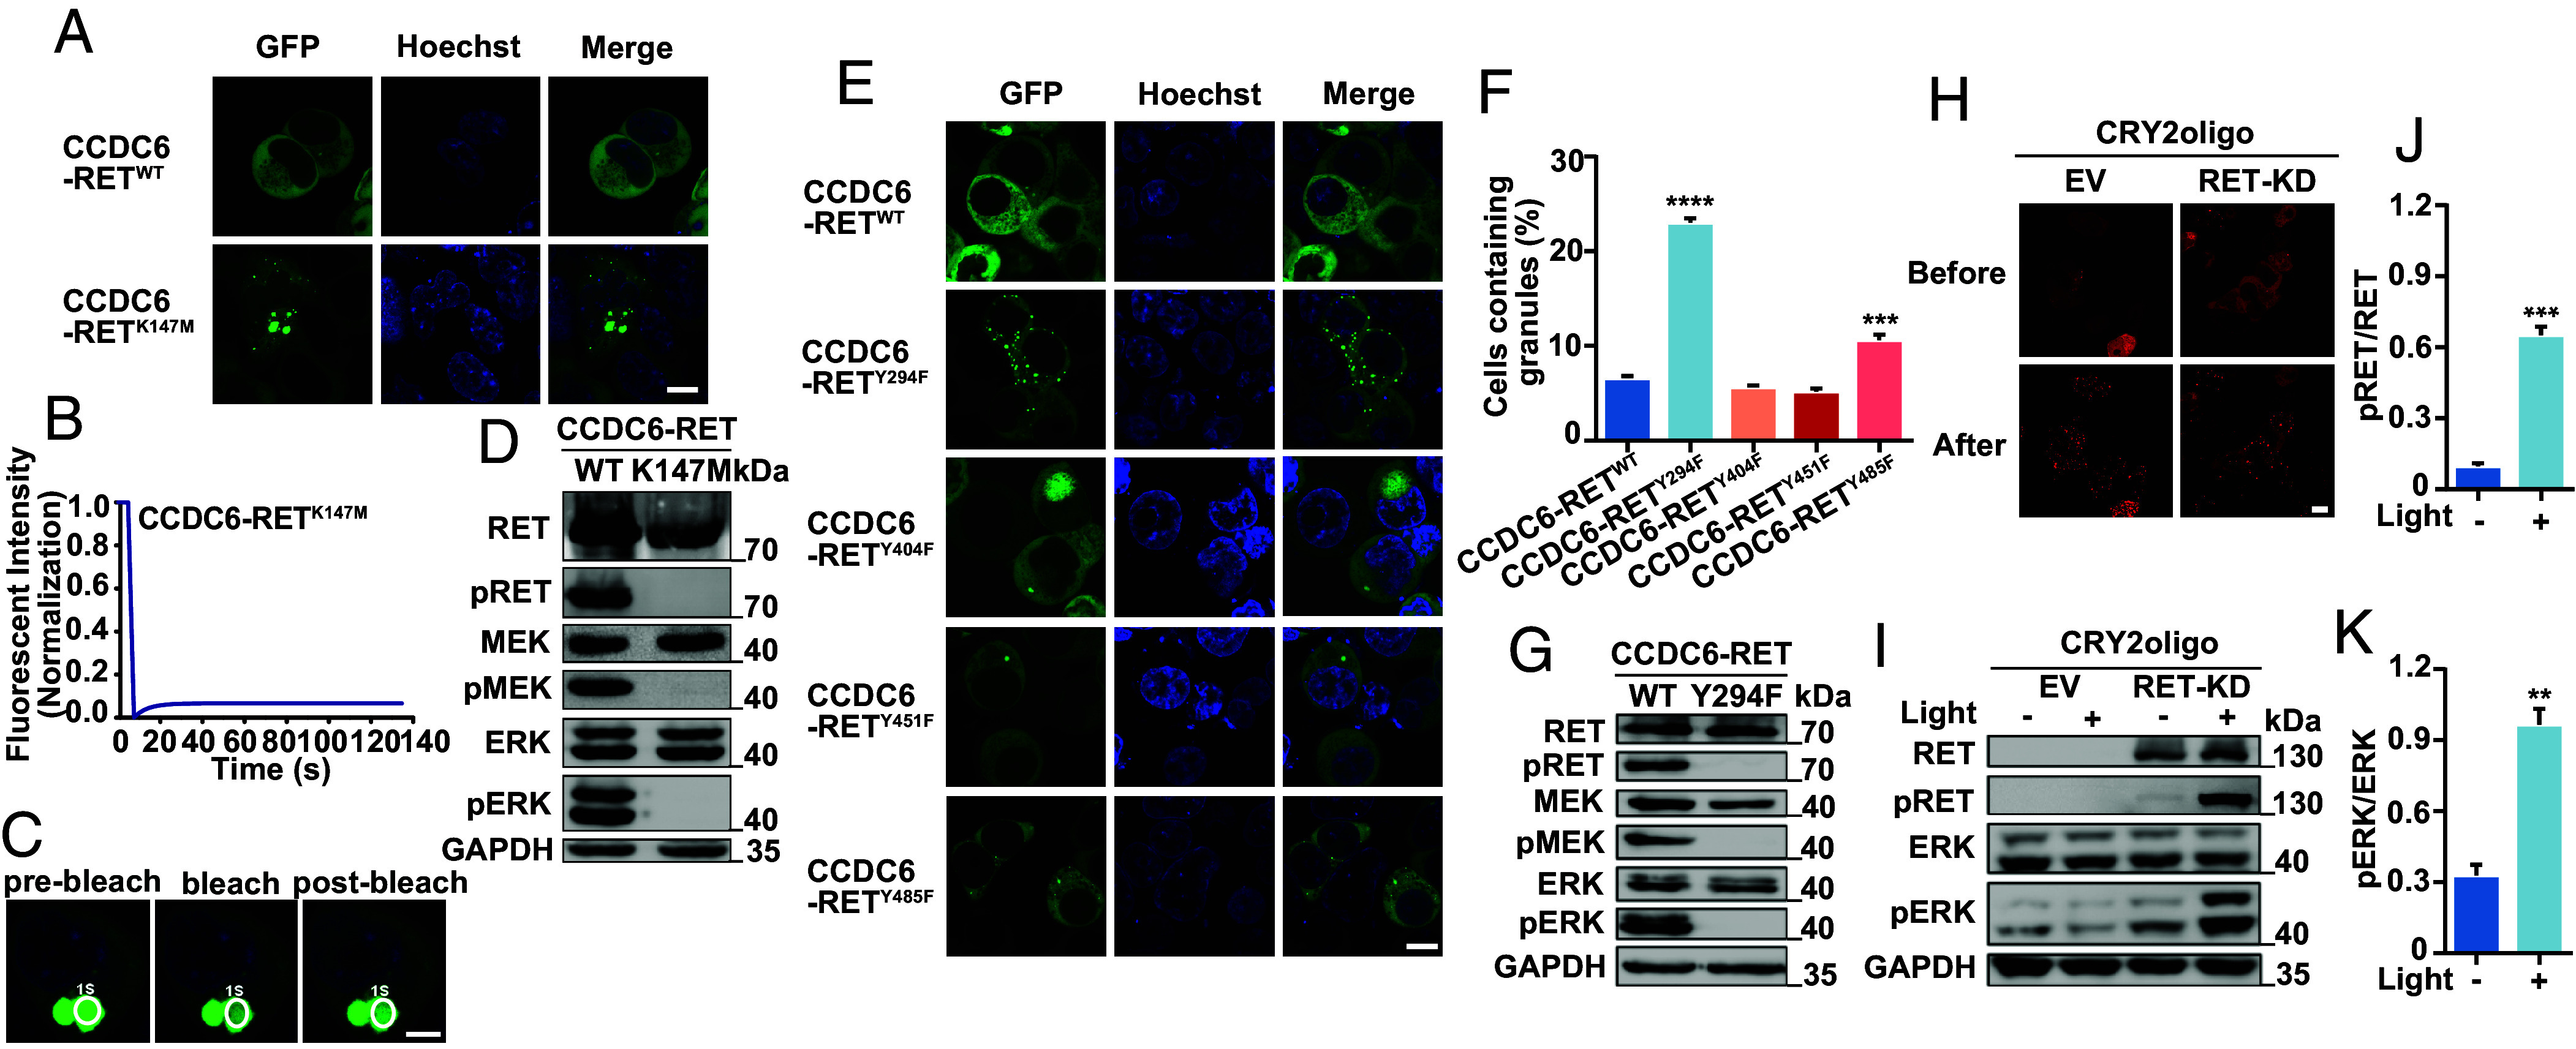
Fig. 4.

The LLPS interplay with RET kinase activity and function. (A) Live-cell imaging of CCDC6-RET-EGFP or CCDC6-RETK147M-EGFP mutant expressed in HEK293T cells, respectively, n ≥ 3. (Scale bar, 10 µm.) (B and C) FRAP of CCDC6-RETK147M-EGFP transfected in HEK293T cells. The FRAP curves in B and the corresponding droplet at the bleached area in C. (Scale bar, 5 µm.) (D) Western blotting upon expression of CCDC6-RET-EGFP or CCDC6-RETK147M-EGFP mutant in HEK293T cells. (E) Live-cell imaging of CCDC6-RET-EGFP or its related phosphorylation site mutations consisting of Y294F, Y404F, Y451F, and Y485F expressed in HEK293T cells, n ≥ 3. (Scale bar, 10 µm.) (F) Proportion of cells with protein condensates upon transfection of CCDC6-RET-EGFP, Y294F, Y404F, Y451F, or Y485F mutations in HEK293T cells. Error bars indicate SD from three regions in the imaged sample selected for counting, with each region containing more than 200 total cells. ****P < 0.0001 and ***P < 0.001 versus CCDC6-RET by Student’s t test. (G) Western blotting upon expression of CCDC6-RET-EGFP or CCDC6-RETY294F -EGFP mutant in HEK293T cells. (H–K) The RET-fusion active Ras/MAPK via LLPS. The time-lapse images of RET-KD linked to CRY2oligo-mCherrry before/after 488 nm blue light induced in H. Western blot upon expression 24 h of EV or RET-KD linked to CRY2oligo-mCherrry illuminated by 488 nm blue light at 20% power for 5 min/cycle remaining three cycles in 96-well plates in I, the analyses of pRET values in J and pERK in K. CRY2oligo-mCherrry alone was used as a control, n ≥ 3. For all panels, error bars represent ± SEM, representative of n ≥ 3 independent experiments. **P < 0.01 and ***P < 0.001 versus before light-induced by Student’s t test. (Scale bar, 10 µm.)
