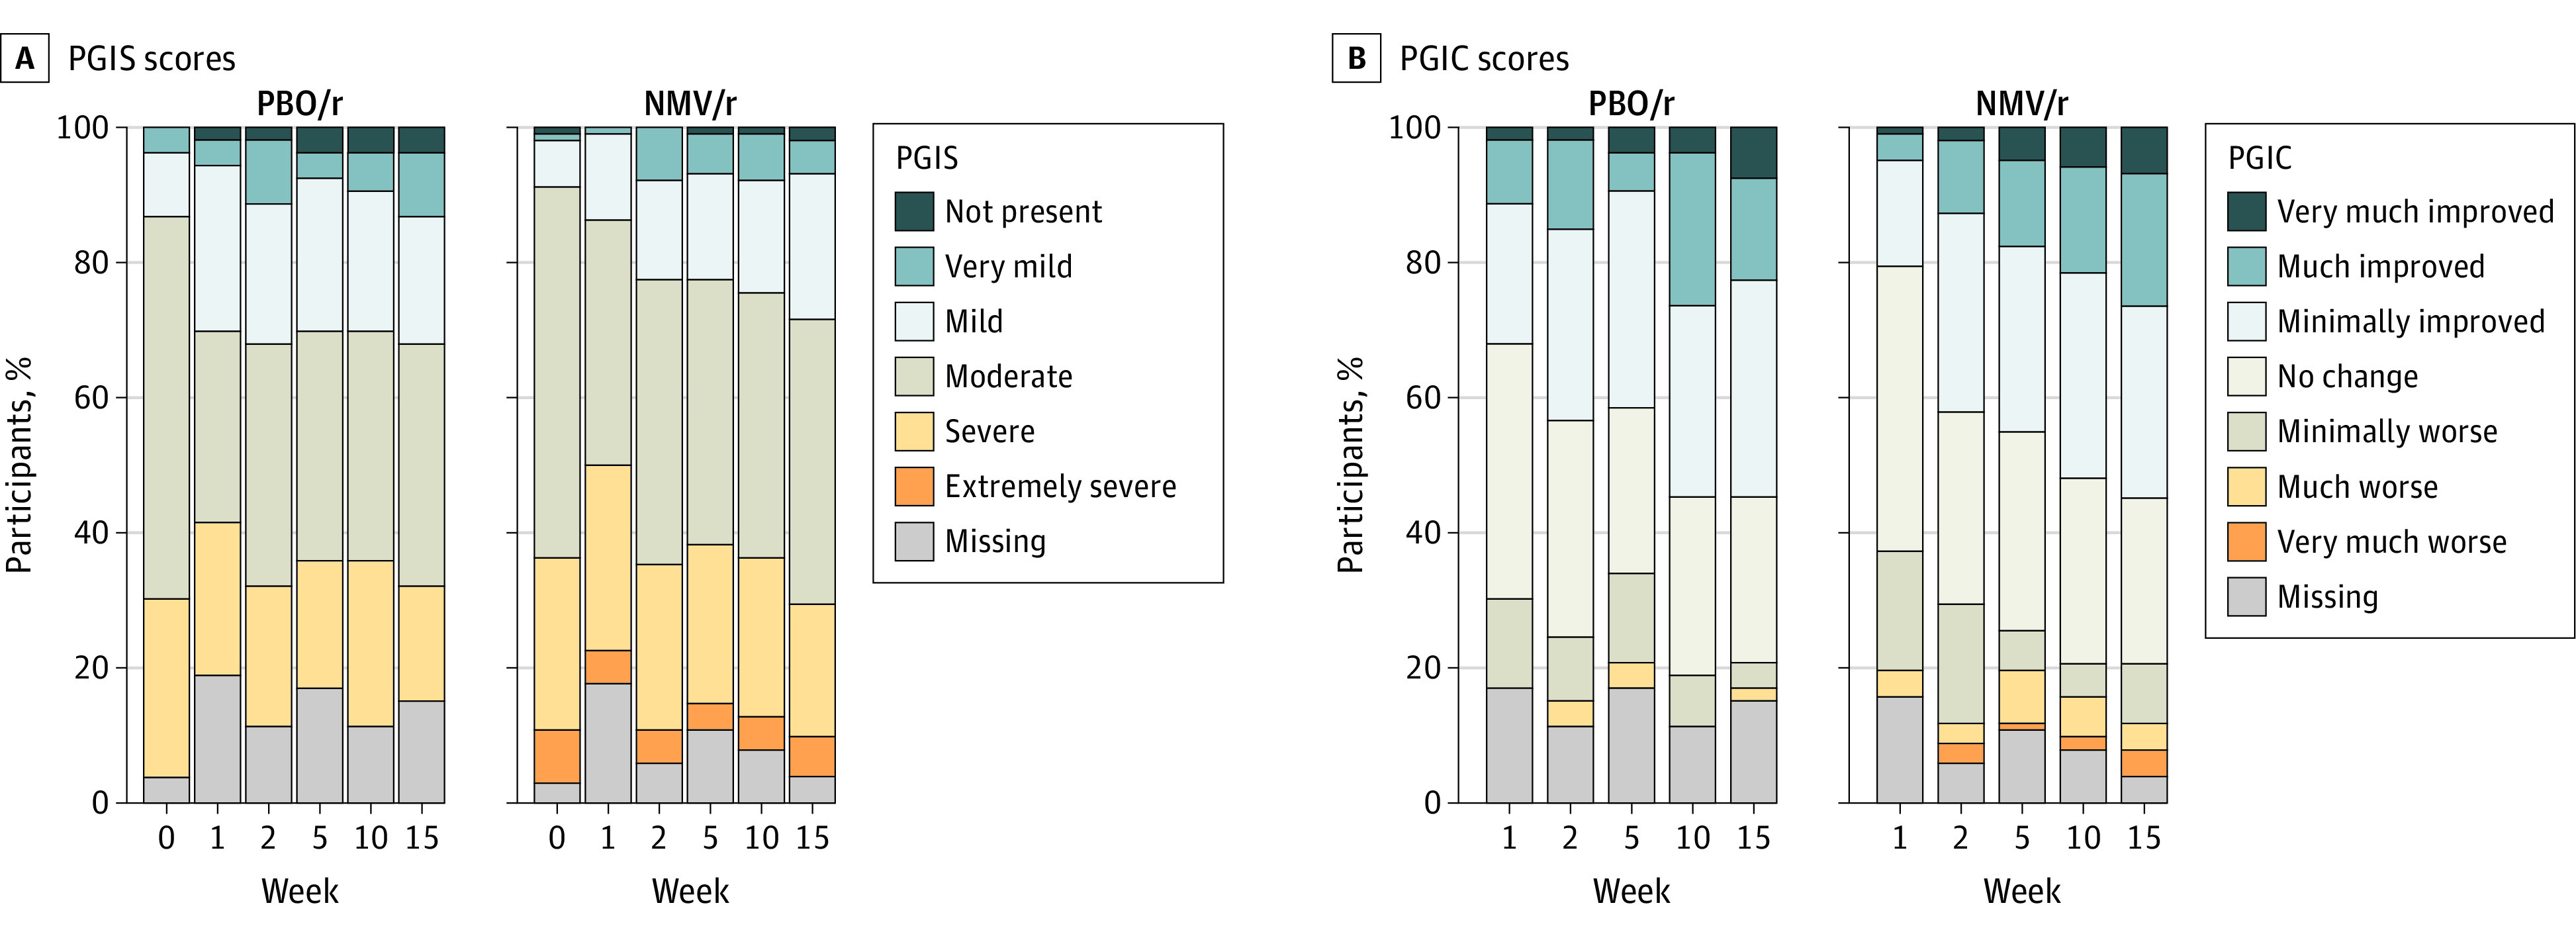
Figure 3. Patient Global Impression Scores Over Time in Adults With Postacute Sequelae of SARS-CoV-2 Infection.

Likert plots depict the distribution of PGIS (A) and PGIC (B) scores at each week, by treatment group. NMV/r indicates nirmatrelvir-ritonavir; PBO/r, placebo-ritonavir; PGIC, Patient Global Impression of Change; and PGIS, Patient Global Impression of Severity.
