Fig. 1.
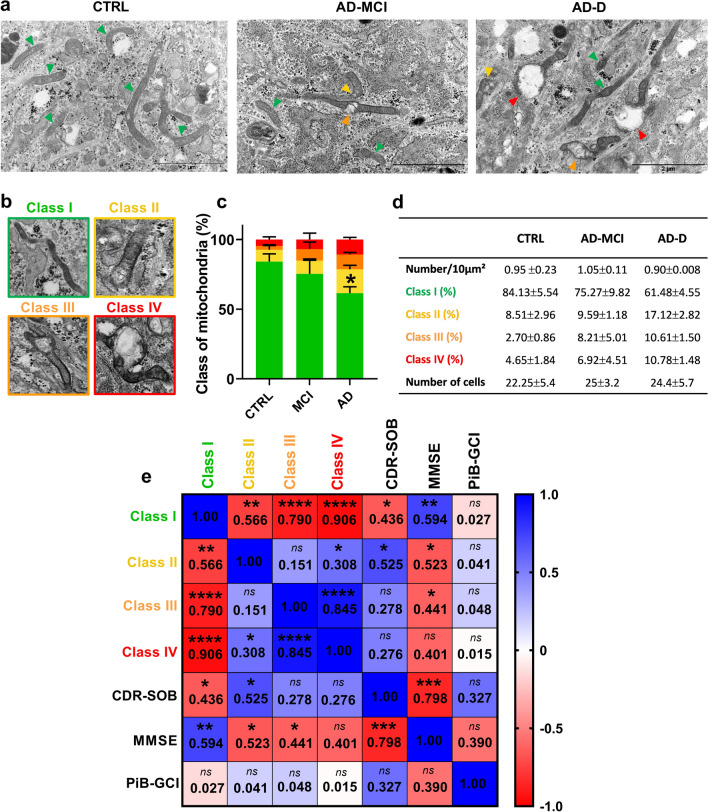
Mitochondrial classes distribution differ among CTRL, AD-MCI and AD-D fibroblasts and correlates with cognitive impairments. a Representative electron microscopy images of the ultrastructures of CTRL, AD-MCI and AD-D fibroblasts. N: nuclei. The colored arrowheads indicate mitochondria (green = class I, yellow = class II, orange = class III and red = class IV). Scale bar = 2 µm. b Representative images of mitochondrial classes I, II, III, and IV. c Quantitative graph of the distribution of mitochondrial classes ± SEM. * p = 0.013 according to 2-way ANOVA and Tukey’s multiple comparisons test versus CTRL class I mitochondria. d Table presenting the average number ± SEM of mitochondria per 10 µm2 and the percentage of mitochondria classes ± SEM obtained from CTRL (n = 4), AD-MCI (n = 4) and AD-D (n = 5) fibroblasts. Mitochondrial ultrastructure was quantified in the CTRL group (4 individuals, n = 89 cells), AD-MCI group (4 patients, n = 100 cells) and AD-D group (4 patients, n = 122 cells) (between 100 and 300 mitochondria/patient). e Heatmap of the correlation matrix computed linear regression value (R2) between mitochondrial classes (I, II, III and IV) and the clinical Dementia Rating (Sum of Boxes) (CDR-SOB), the Mini Mental State Examination (MMSE) and the β-amyloid plaque burden assessed using the 11C‐labelled Pittsburgh compound B (Global Cortical Index) (PiB-GCI) through positron emission tomography (PET-scan) at patient inclusion. A color scale of 1 corresponds to the maximum positive correlation value (blue), and a scale of − 1 corresponds to the maximum negative correlation value (red). *p < 0.05; **p < 0.01; ***p < 0.001; ****p < 0.0001 for the correlation of every pair of data sets

