Fig. 2.
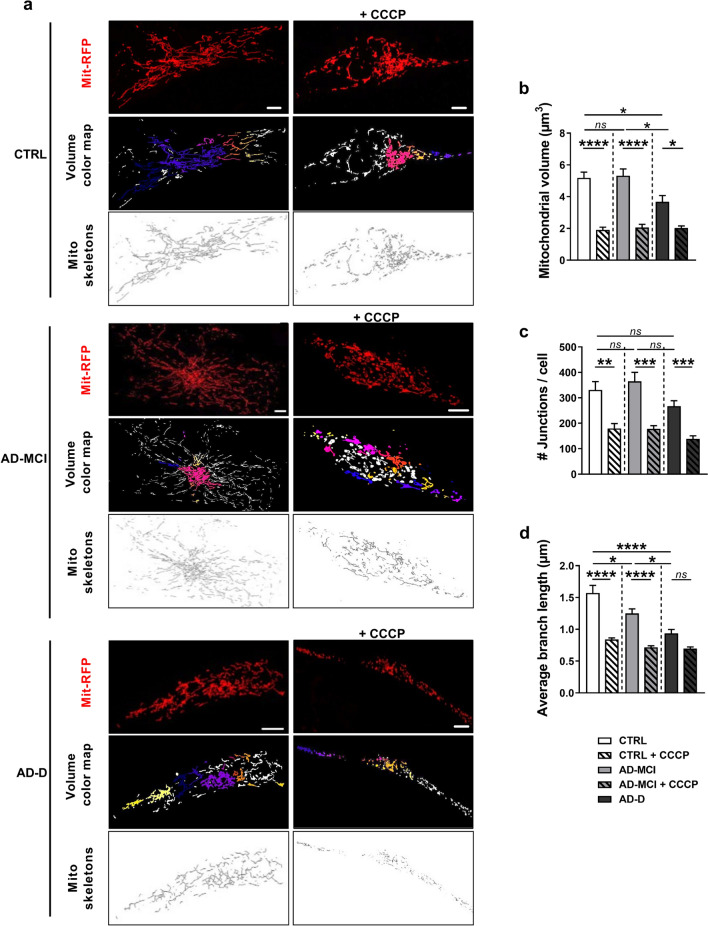
Mitochondrial volume and network organization are more strongly impacted in AD-D fibroblasts than in AD-MCI fibroblasts. a Representative images of mitochondrial network morphology in CTRL, AD-MCI and AD-D fibroblasts transfected with the Mit-RFP probe and treated with or without 10 µM CCCP for 6 h. Scale bar = 2 µm. The original images were processed with the Fiji 3D Counter or skeletonize plugin providing the volume color map and the mitochondrial network skeletons. The mitochondrial volume, number of junctions and branch length were quantified in the CTRL group (4 individuals, n = 59 cells), AD-MCI group (4 patients, n = 61 cells) and AD-D group (4 patients, n = 56 cells). b–d Quantitative graphs of the mitochondrial volume (µm3) (b), the number of junctions (c) and the mean branch length (µm) (d) in the mitochondrial network in individual cells. Means ± SEM were obtained for the CTRL (n = 4), AD-MCI (n = 4) and AD-D (n = 4) groups. *p < 0.05; **p < 0.01; ***p < 0.001; ****p < 0.0001

