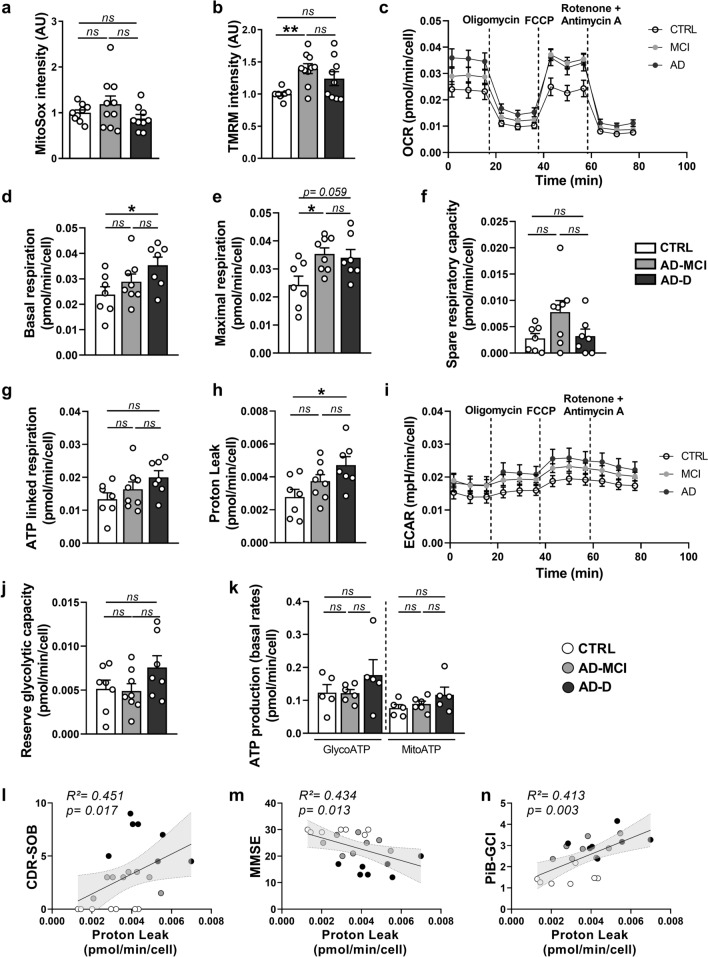
Fig. 3.
Mitochondrial function in AD-D fibroblasts is altered in a disease-specific manner in AD-MCI patients. a Quantitative graph of MitoSOX mean intensity ± SEM obtained by flux cytometry analyses of the CTRL (n = 9), AD-MCI (n = 10) and AD-D (n = 9) groups. ns: not significant. b Quantitative graph of TMRM mean intensity ± SEM obtained by flux cytometry analyses of the CTRL (n = 8), AD-MCI (n = 10) and AD-D (n = 9) groups. **p < 0.01; ns: not significant. c–j Cell respiratory capacity in CTRL (n = 7), AD-MCI (n = 8) and AD-D (n = 7) fibroblasts determined using a SeaHorse XFe96 extracellular flux analyzer (Mito Stress Test). k ATP production measured using a SeaHorse XFe96 extracellular flux analyzer (ATP rate assay) in CTRL (n = 5), AD-MCI (n = 6) and AD-D (n = 5) fibroblasts. The data are expressed in pmol/min/cell ± SEM or mpH/min/cell ± SEM obtained from 5 replicates for each type of fibroblast. *p < 0.05; **p < 0.01; ****p < 0.0001; ns: not significant. l–n Correlation plots between proton leakage and the CDR-SOB (l), MMSE (m), and PiB-GCI (n) scores at patient inclusion, including the CTRL (white dots), AD-MCI (gray dots) and AD-D (black dots) groups. Linear regression was used to determine the P and goodness of fit (R2) values

