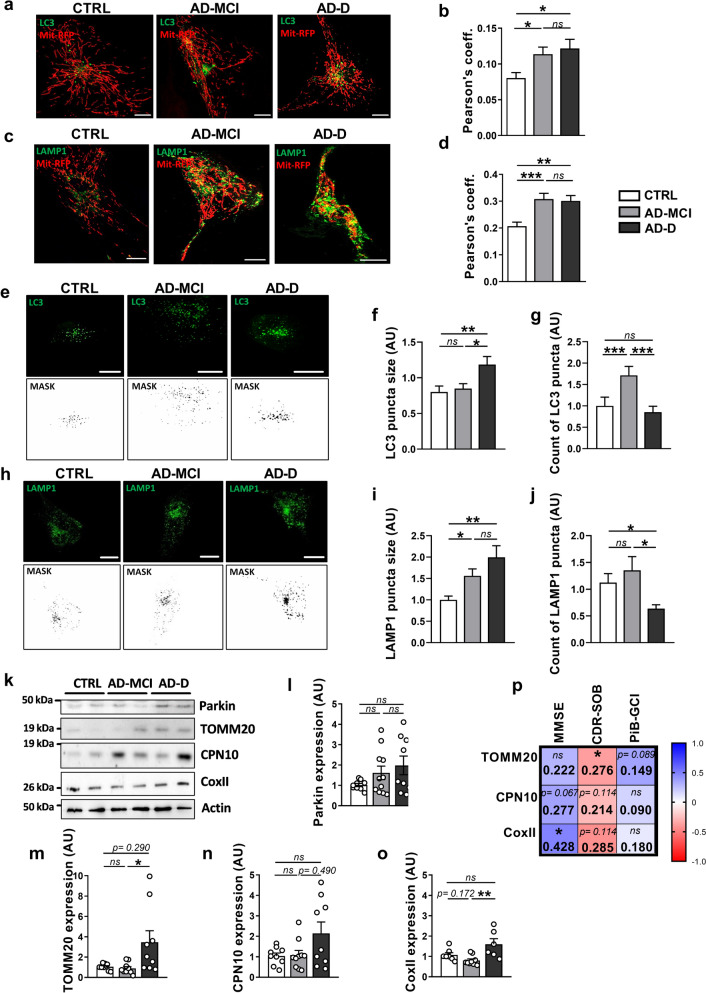
Fig. 4.
Mitophagosomes, mitolysosomes, autophagosomes and lysosomes as well as mitochondrial content analyses reveal defective mitophagy and autophagy processes in AD-D fibroblasts. a, c Representative images of Mit-RFP (red), LC3-GFP (a) or LAMP1-GFP (b) (green) signals in CTRL, AD-MCI and AD-D fibroblasts. The merged signal (yellow) reflects the colocalization of the red and green signals. Scale bars = 2 μm. b, d Quantitative graphs of the colocalization (Pearson’s coefficient) of Mit-RFP with LC3-GFP from CTRL (5 individuals, n = 42 cells), AD-MCI (6 patients, n = 49 cells), and AD-D (5 patients, n = 33 cells) (b) or of Mit-RFP with LAMP1-GFP from CTRL (5 individuals, n = 41 cells), AD-MCI (5 patients, n = 40 cells), and AD-D (5 patients, n = 40 cells) (d). Means ± SEMs *p < 0.05; **p < 0.01; ***p < 0.001; ns: not significant. e–j Representative images and masks of LC3-GFP (e) and LAMP1-GFP (h) signals in CTRL, AD-MCI and AD-D fibroblasts. Scale bar = 2 µm. f, i Quantitative graph of the number ± SEM of LC3-GFP puncta (f) and LAMP1 puncta (i). g, j Quantitative graph of the size ± SEM of LC3-GFP puncta (g) and LAMP1 puncta (j). The data were obtained from the CTRL group (5 individuals, n = 41 cells), AD-MCI group (6 patients, n = 49 cells) and AD-D group (5 patients, n = 40 cells). *p < 0.05; **p < 0.01; ***p < 0.001; ns: not significant. K–n SDS‒PAGE (k) and quantitative graphs of Parkin (l), TOMM20 (m), CPN10 (n), and CoxII (o) expression levels ± SEM obtained in mitochondria-enriched fractions of CTRL (n = 9), AD-MCI (n = 11) and AD-D (n = 9) fibroblasts. The data were normalized to those of CTRL fibroblasts. *p < 0.05; **p < 0.01; ns: not significant. p Heatmap of the correlation matrix computed linear regression (R2) between TOMM20, CPN10 and CoxII expression levels and the clinical Dementia Rating (Sum of Boxes) (CDR-SOB), the Mini Mental State Examination (MMSE) and the β-amyloid plaque burden assessed using the 11C‐labelled Pittsburgh compound B (Global Cortical Index) (PiB-GCI) through positron emission tomography (PET-scan) at patient inclusion. A color scale of 1 corresponds to the maximum positive correlation value (blue), and a scale of − 1 corresponds to the maximum negative correlation value (red). *p < 0.05 for every pair of data sets

