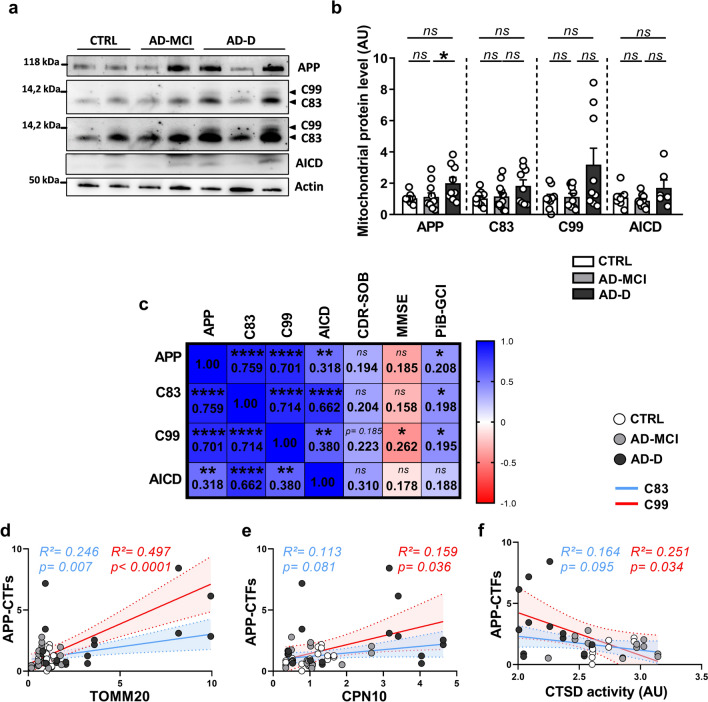
Fig. 6.
APP and APP-CTFs accumulation in the mitochondria of AD-D fibroblasts is correlated with cognitive impairments, reduced mitochondrial protein load and reduced CTSD activity. a, b Representative WB (a) and quantitative graphs of the expression levels ± SEM (b) of full-length APP (APP Total) and APP-CTFs (C99, C83 and AICD) obtained from mitochondria-enriched fractions of CTRL (n = 9), AD-MCI (n = 11) and AD-D (n = 9) fibroblasts. The data were normalized to those of CTRL fibroblasts. *p < 0.05; ns: not significant. c Heatmap of the correlation matrix computed via linear regression (R2) between the protein levels of full-length APP, C83, C99 and AICD fragments and the clinical Dementia Rating (Sum of Boxes) (CDR-SOB), Mini Mental State Examination (MMSE) and β-amyloid plaque burden assessed using the 11C‐labelled Pittsburgh compound B (Global Cortical Index) (PiB-GCI) through positron emission tomography (PET-scan) at patient inclusion. A color scale of 1 corresponds to the maximum positive correlation value (blue), and a scale of − 1 corresponds to the maximum negative correlation value (red). *p < 0.05; **p < 0.01; ****p < 0.0001; ns: not significant for the correlation of every pair of data sets. e–f Correlation plots between APP-CTFs and TOMM20 (d), CPN10 (e), or CTSD activity (f) in the CTRL (white dots), AD-MCI (gray dots) and AD-D (black dots) groups. Linear regression with C99 (red) or C83 (blue) was used to determine the P and goodness of fit (R2) values

