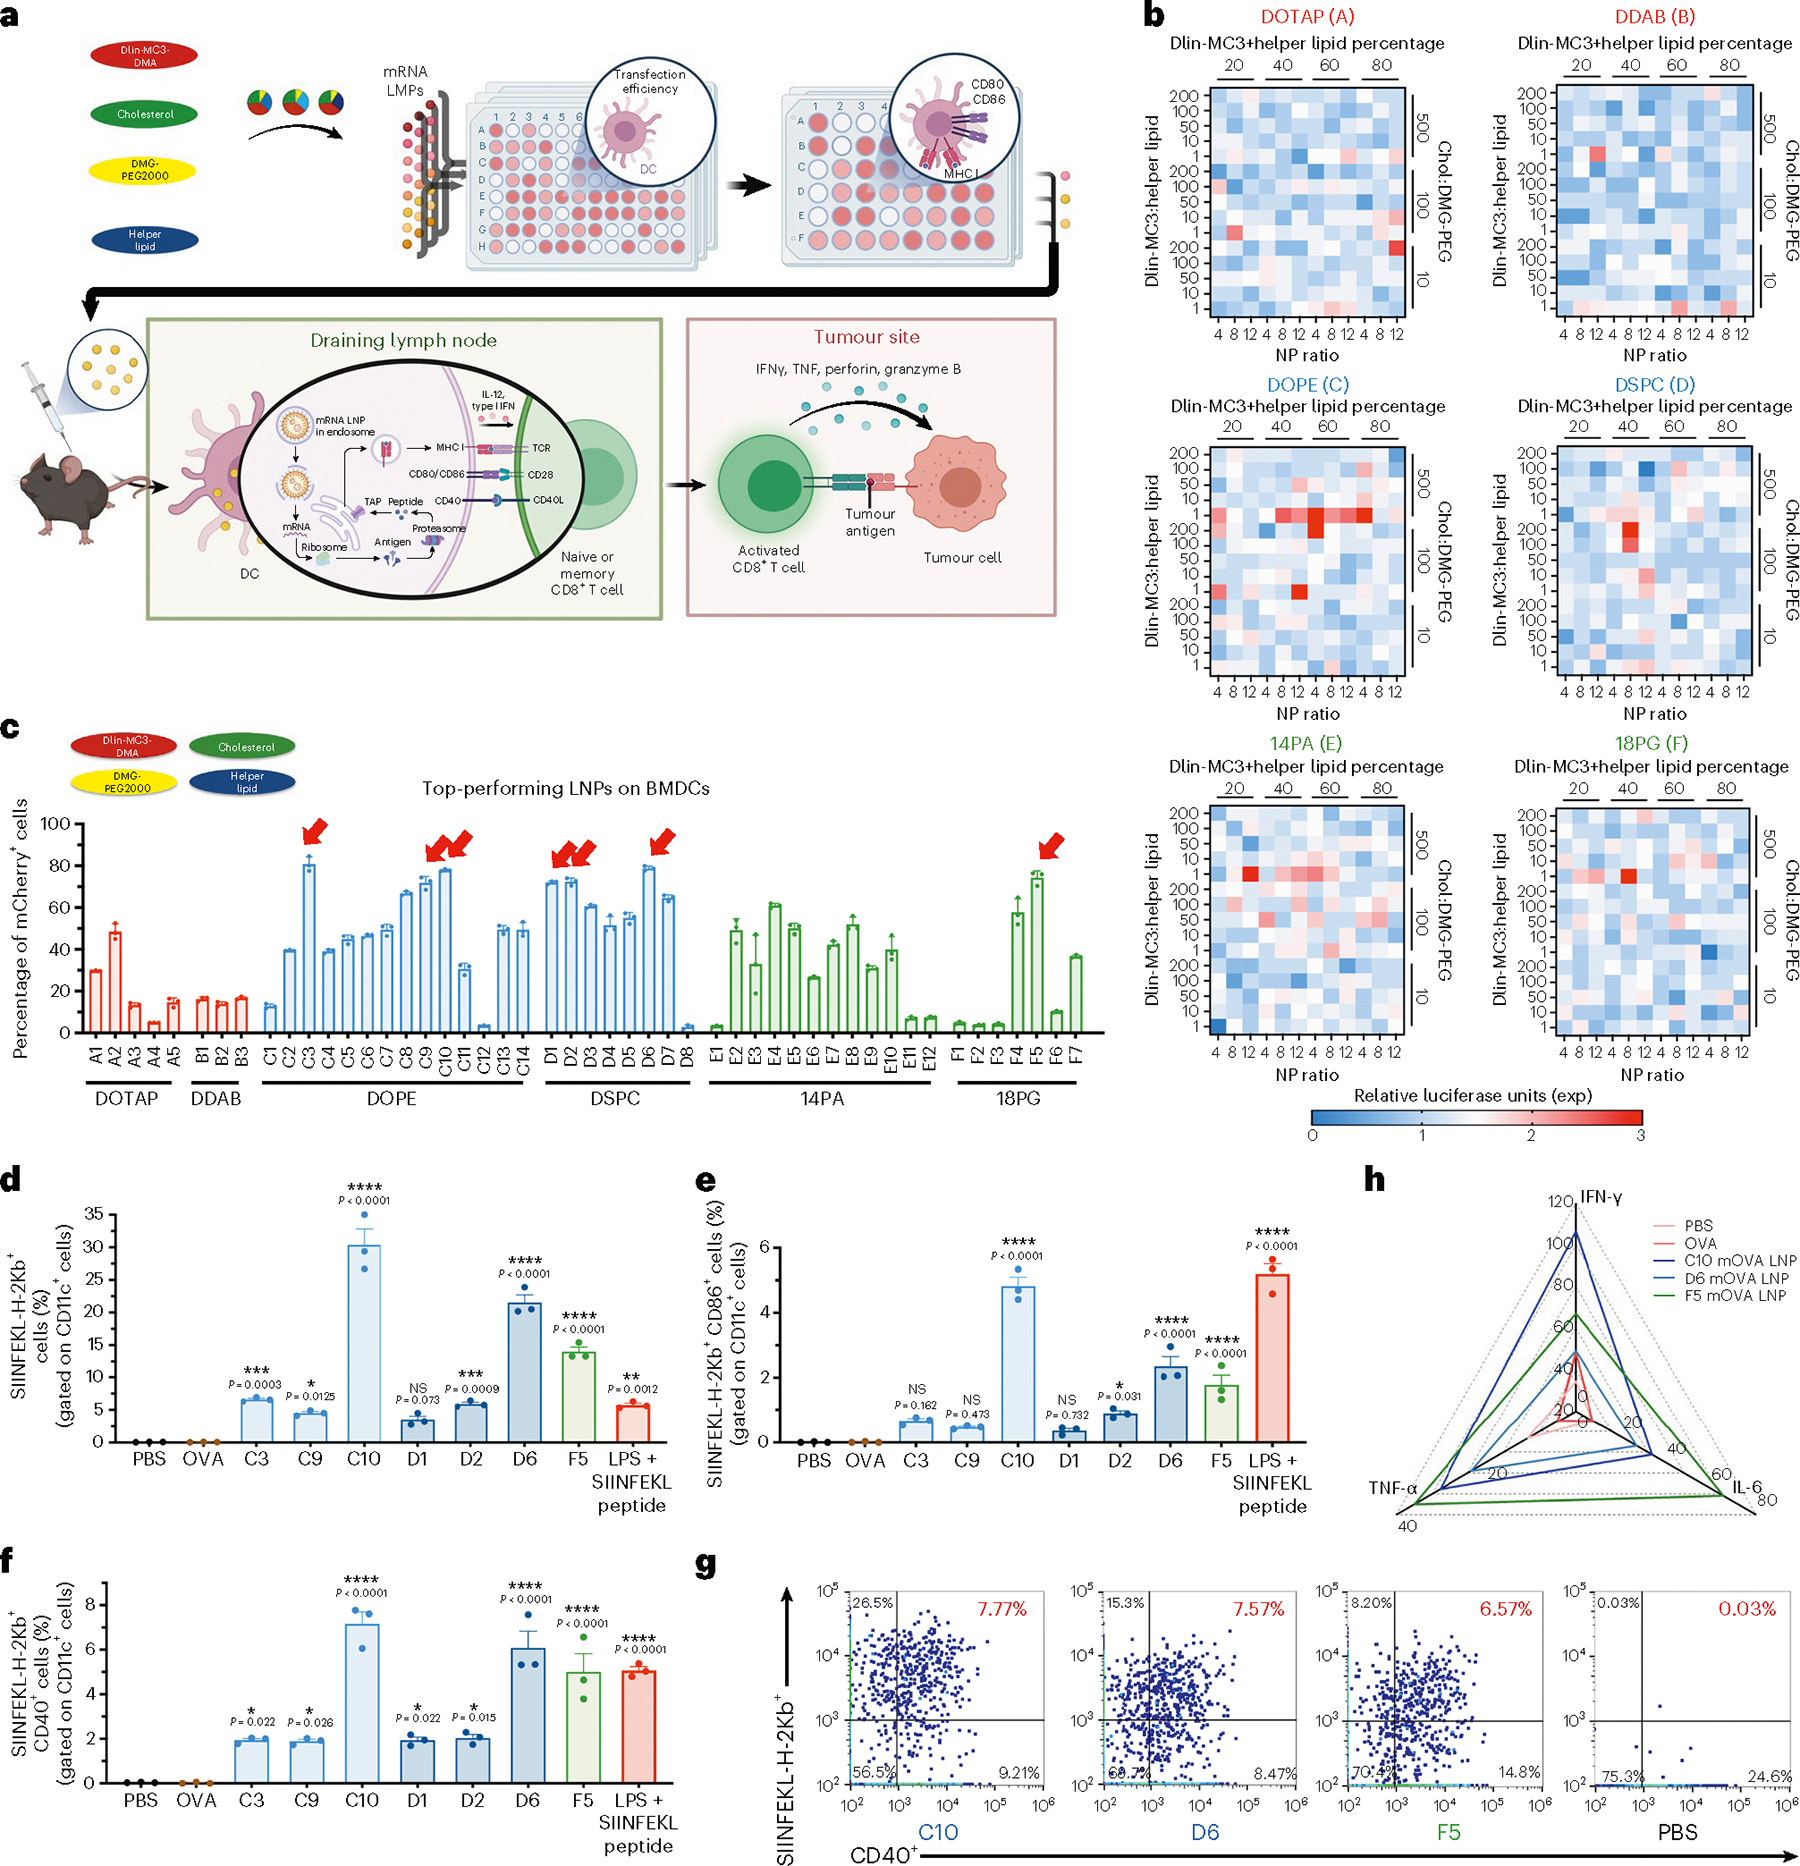
Fig. 1 |. In vitro screening of mRNA lipid nanoparticles for the transfection and induction of antigen presentation and maturation in DCs.

a, Schematic of the screening method and the therapeutic mechanism of mRNA LNP vaccination against a solid tumour. In vitro transfection efficiency was assessed for 1,080 LNP formulations with different helper lipids and component ratios. The top-performing formulations were then tested on BMDCs for transfection and antigen presentation, and in vivo immune responses induced by selected LNPs were assessed. LNPs transfect tissue-resident DCs following s.c. injection, or drain into the neighboring lymph nodes where they transfect APCs including DCs. These APCs translate and process the mRNA into peptides presented on major histocompatibility complex molecules on the cell surface. The lipids also trigger activation pathways that promote co-stimulatory molecule expression and cytokine release. T cells activated by the APCs proliferate and travel to the tumour site to kill cancer cells in an antigen-specific manner. TAP, transporter associated with antigen processing; TCR, T cell receptor; TNF-α, tumour necrosis factor α. b, DC2.4 cells were treated with fLuc mRNA LNPs (1 μg ml−1). The relative luciferase expression after 24 h incubation with fLuc mRNA LNPs is shown in a heat map. c, BMDCs were treated with the 49 top-performing LNPs packaged with mCherry mRNA. The percentage of mCherry+ cells gated on CD11c+ cells after 24 h incubation with mRNA LNPs is shown. LNP formulation details are shown in pie charts with DLin-MC3-DMA in red, cholesterol in green, DMG-PEG2000 in yellow and helper lipids in blue. The top seven formulations, indicated by red arrows, were selected for further study. d–f, Antigen presentation (d), with maturation levels of BMDCs (e,f) were analysed by flow cytometry after 24 h incubation with the seven mOVA-loaded LNPs, PBS, free OVA, or LPS and SIINFEKL peptide. The percentages of SIINFEKL-H-2Kb+ cells (d), additionally positive for CD86 (e) or CD40 (f) gated on CD11c+ cells are shown. g, Representative flow cytometry analysis of SIINFEFL-H-2Kb and CD40 expression on BMDCs treated with the three top-performing LNPs. h, Secretion levels of IFN-γ, TNF-α and IL-6 within the supernatant of BMDCs after 24 h incubation with the three mOVA-loaded LNPs were measured by ELISA and are shown in a radar chart. Data represent the mean ± s.e.m. from a representative experiment (n = 3 (b–g), n = 4 (h) biologically independent samples) of two independent experiments. Data were analysed using one-way ANOVA and Dunnett’s multiple comparisons test against the PBS control group. *P < 0.05, **P < 0.01, ***P < 0.001, ****P < 0.0001; NS, not significant.
