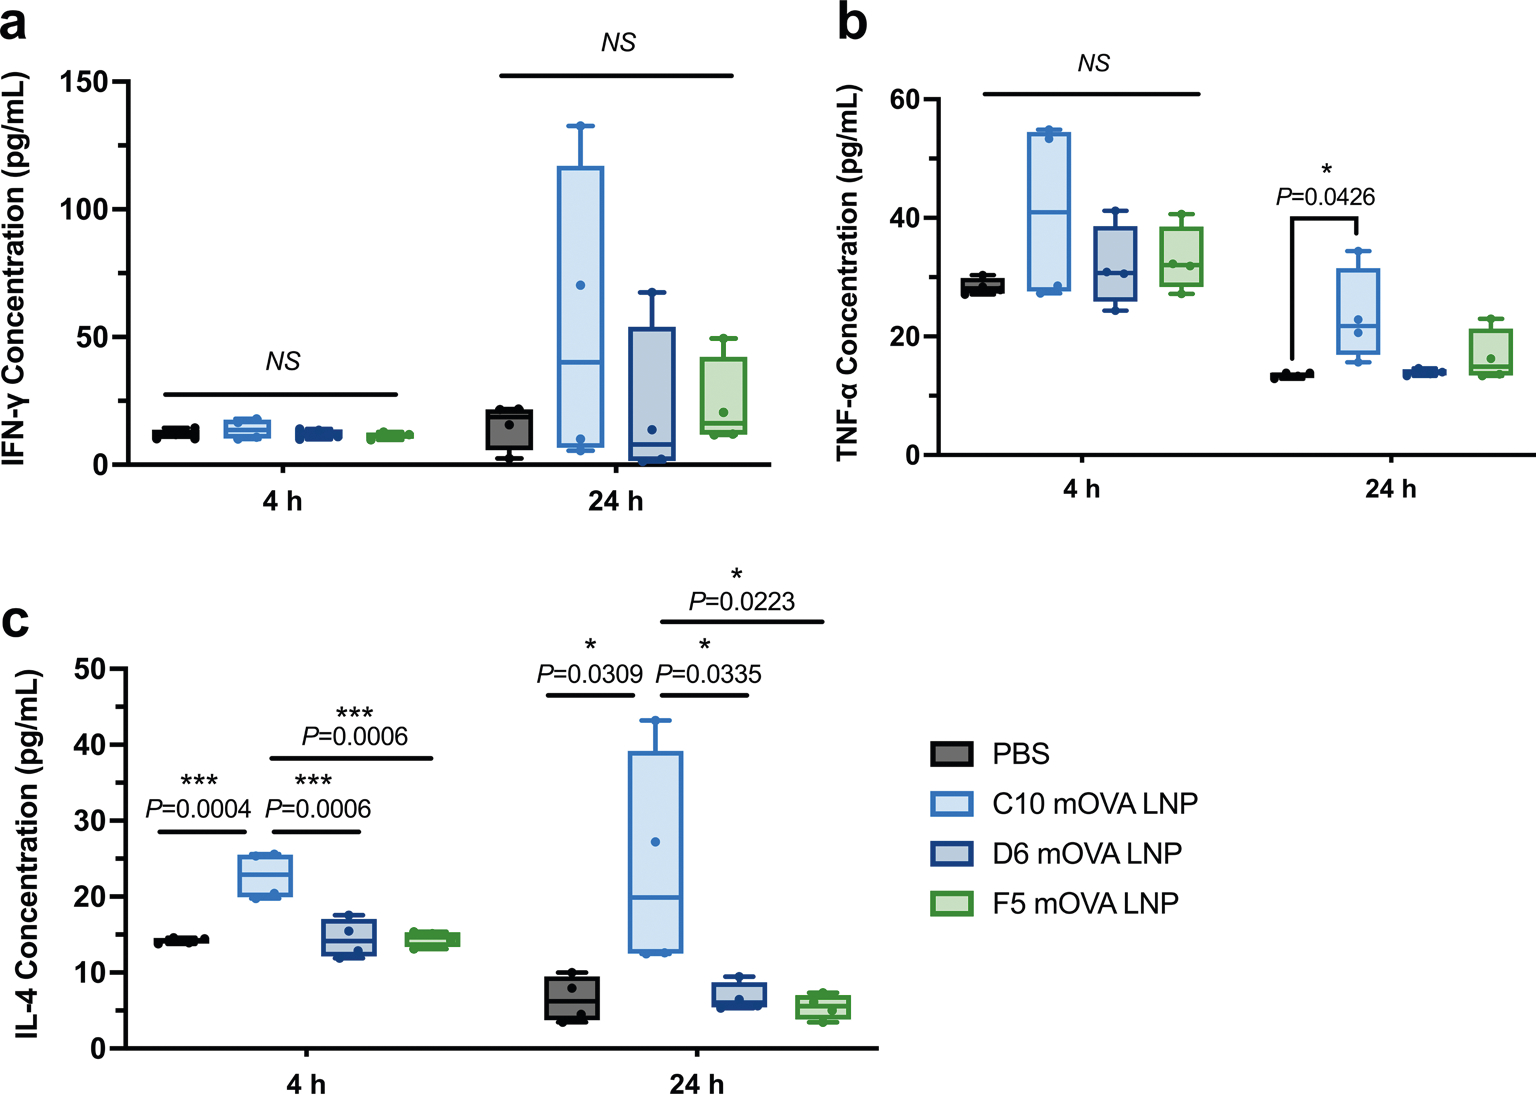
Extended Data Fig. 4 |. Cytokine levels in the local injection site measured at 4 h or 24 h post-administration of the top-performing LNPs.

ELISA was employed to quantify the cytokine levels, including IFN-γ (a), TNF-α (b), and IL-4 (c), at the local injection site using OVA-encoding mRNA after the administration of three formulations (C10, D6, and F5) at 4 h and 24 h. The local injection sites were collected, homogenized, and subjected to tissue lysis to extract the proteins. The resulting lysate was centrifuged to separate the insoluble cellular debris. The protein concentration in each sample was determined using the BCA assay and normalized accordingly. Data represent the mean ± s.e.m. with n = 4 biologically independent samples. Data were analyzed using one-way ANOVA and Tukey’s multiple comparisons test. *P < 0.05; ***P < 0.001; NS, not significant.
