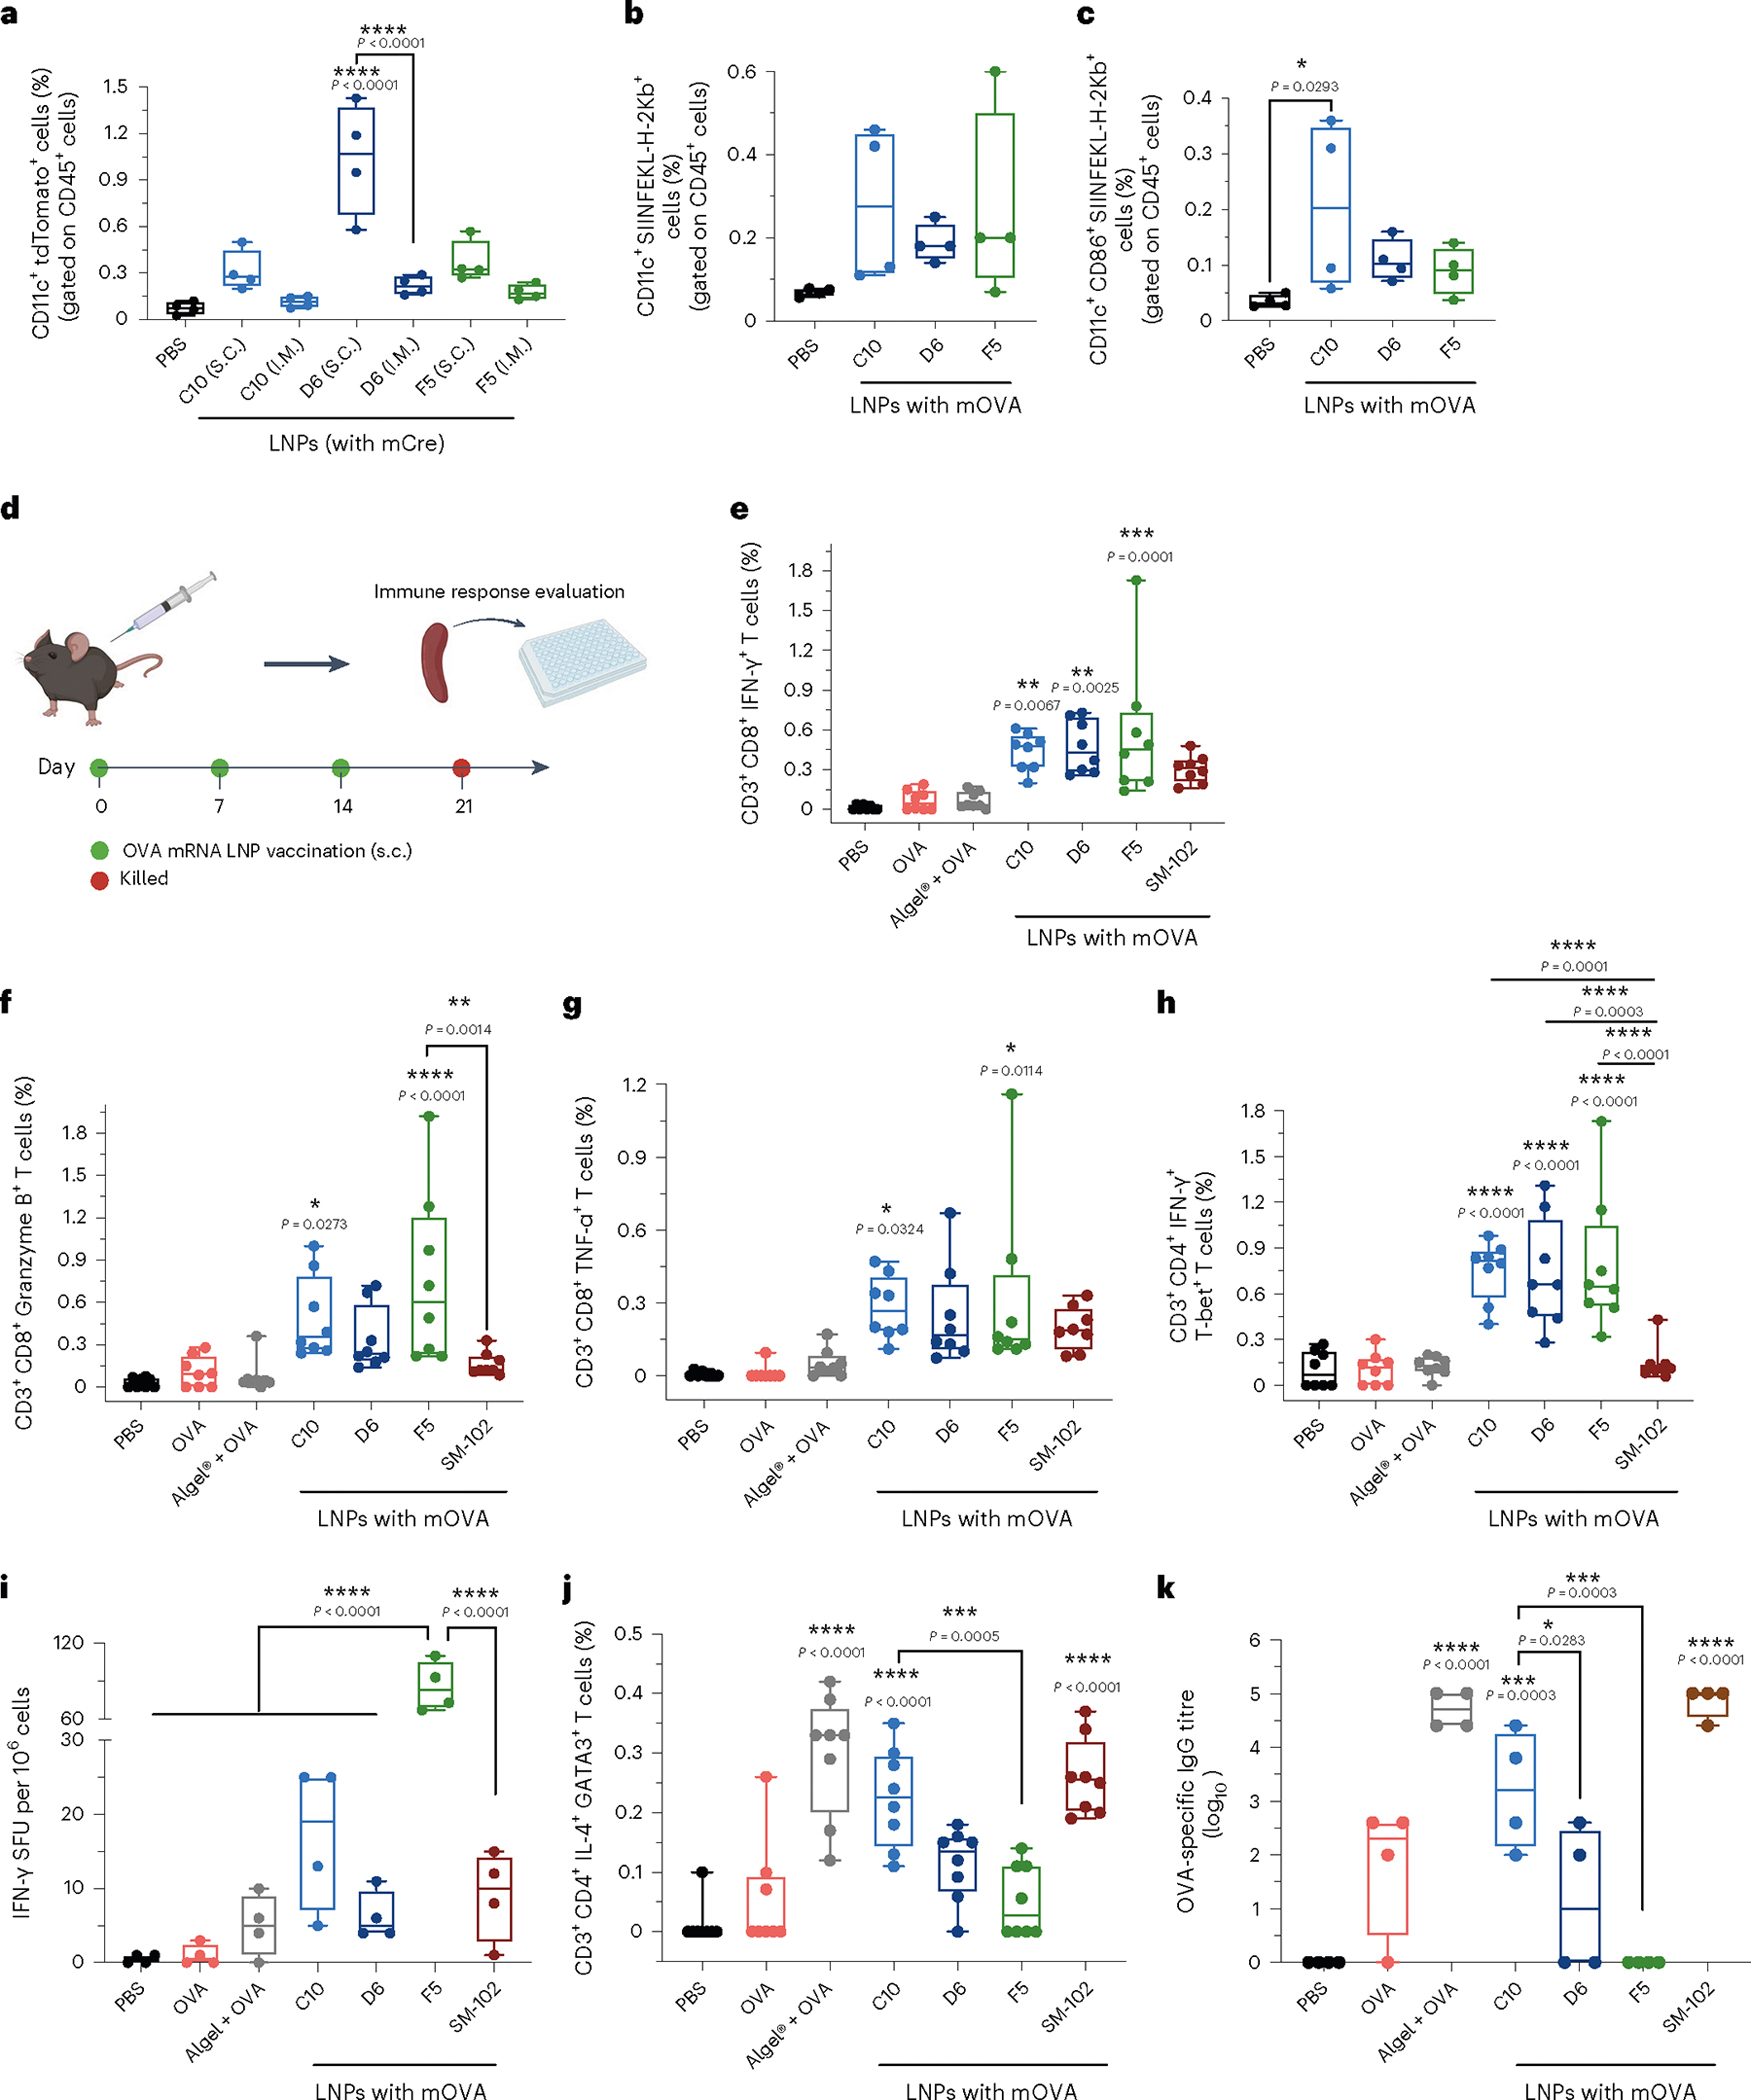
Fig. 2 |. In vivo assessments of lymph-node-cell transfection and immune activation by the top 3 LNP formulations.

a, Ai9 mice were administered the top 3 LNPs loaded with mCre via i.m. and s.c. injections (10 μg mCre per mouse). Transfection of immune cells in draining lymph nodes was analysed by flow cytometry. Percentages of cells positive for tdTomato as well as CD11c gated on CD45+ cells are shown. Gating strategy is shown in Supplementary Fig. 4. b,c, C57BL/6 mice were administered PBS or C10, D6 or F5 LNPs loaded with mOVA via s.c. injection. DC antigen presentation (b), with maturation levels (c) in the draining lymph nodes were analysed using flow cytometry after 3 d following a single dosage of mRNA LNPs. Cells positive for CD11c and SIINFEKL-H-2Kb (b), as well as CD86 (c) are shown. Gating strategy is shown in Supplementary Fig. 6. d, Timeline for the immune activation experiment. C57BL/6 mice were given three s.c. injections, 1 week apart, of PBS, free OVA protein, or C10, D6 or F5 LNPs loaded with mOVA (10 μg OVA protein or 10 μg mOVA per injection). Mice were killed 1 week after the final injection, and their splenocytes and lymphocytes were isolated for analysis. e–h, C57BL/6 mice were administered with PBS, free OVA protein, OVA protein mixed with aluminum hydroxide gel (Alhydrogel) (1:1), or C10, D6, F5 or SM-102 LNPs loaded with mOVA via s.c. injection (10 μg OVA protein or 10 μg mOVA per injection). Splenocytes were restimulated in vitro with OVA and SIINFEKL peptide (100 μg ml−1 OVA and 2 μg ml−1 SIINFEKL) for 6 h and assessed via flow cytometry and intracellular cytokine staining to determine the percentages of CD3+CD8+IFN-γ+ (e), CD3+CD8+Granzyme B+ (f), CD3+CD8+TNF−α+ (g) and CD3+CD4+IFN−γ+T-bet+ (h) cells. i, Frequency of IFN-γ-producing cells in spot-forming unit (SFU) among restimulated splenocytes, assessed via ELISpot. j, Percentage of restimulated splenocytes positive for CD3, CD4, IL-4 and GATA-3, assessed by flow cytometry and ICS and representing Th2 cells. Gating strategy is shown in Supplementary Figs. 7–12 and 14. k, Titres of OVA-specific IgG antibodies in blood serum on day 21, determined by ELISA. Data represent the mean ± s.e.m. from a representative experiment (n = 4 (a–c,i,k) biologically independent samples of two independent experiments, n = 8 (e–h,j) biologically independent samples of three independent experiments). Data were analysed using one-way ANOVA and Tukey’s multiple comparisons test for a–c, and e–k. For boxplots, the box extends from the 25th to the 75th percentiles and the line in the middle of the box is plotted at the median. *P < 0.05, **P < 0.01, ***P < 0.001, ****P < 0.0001.
