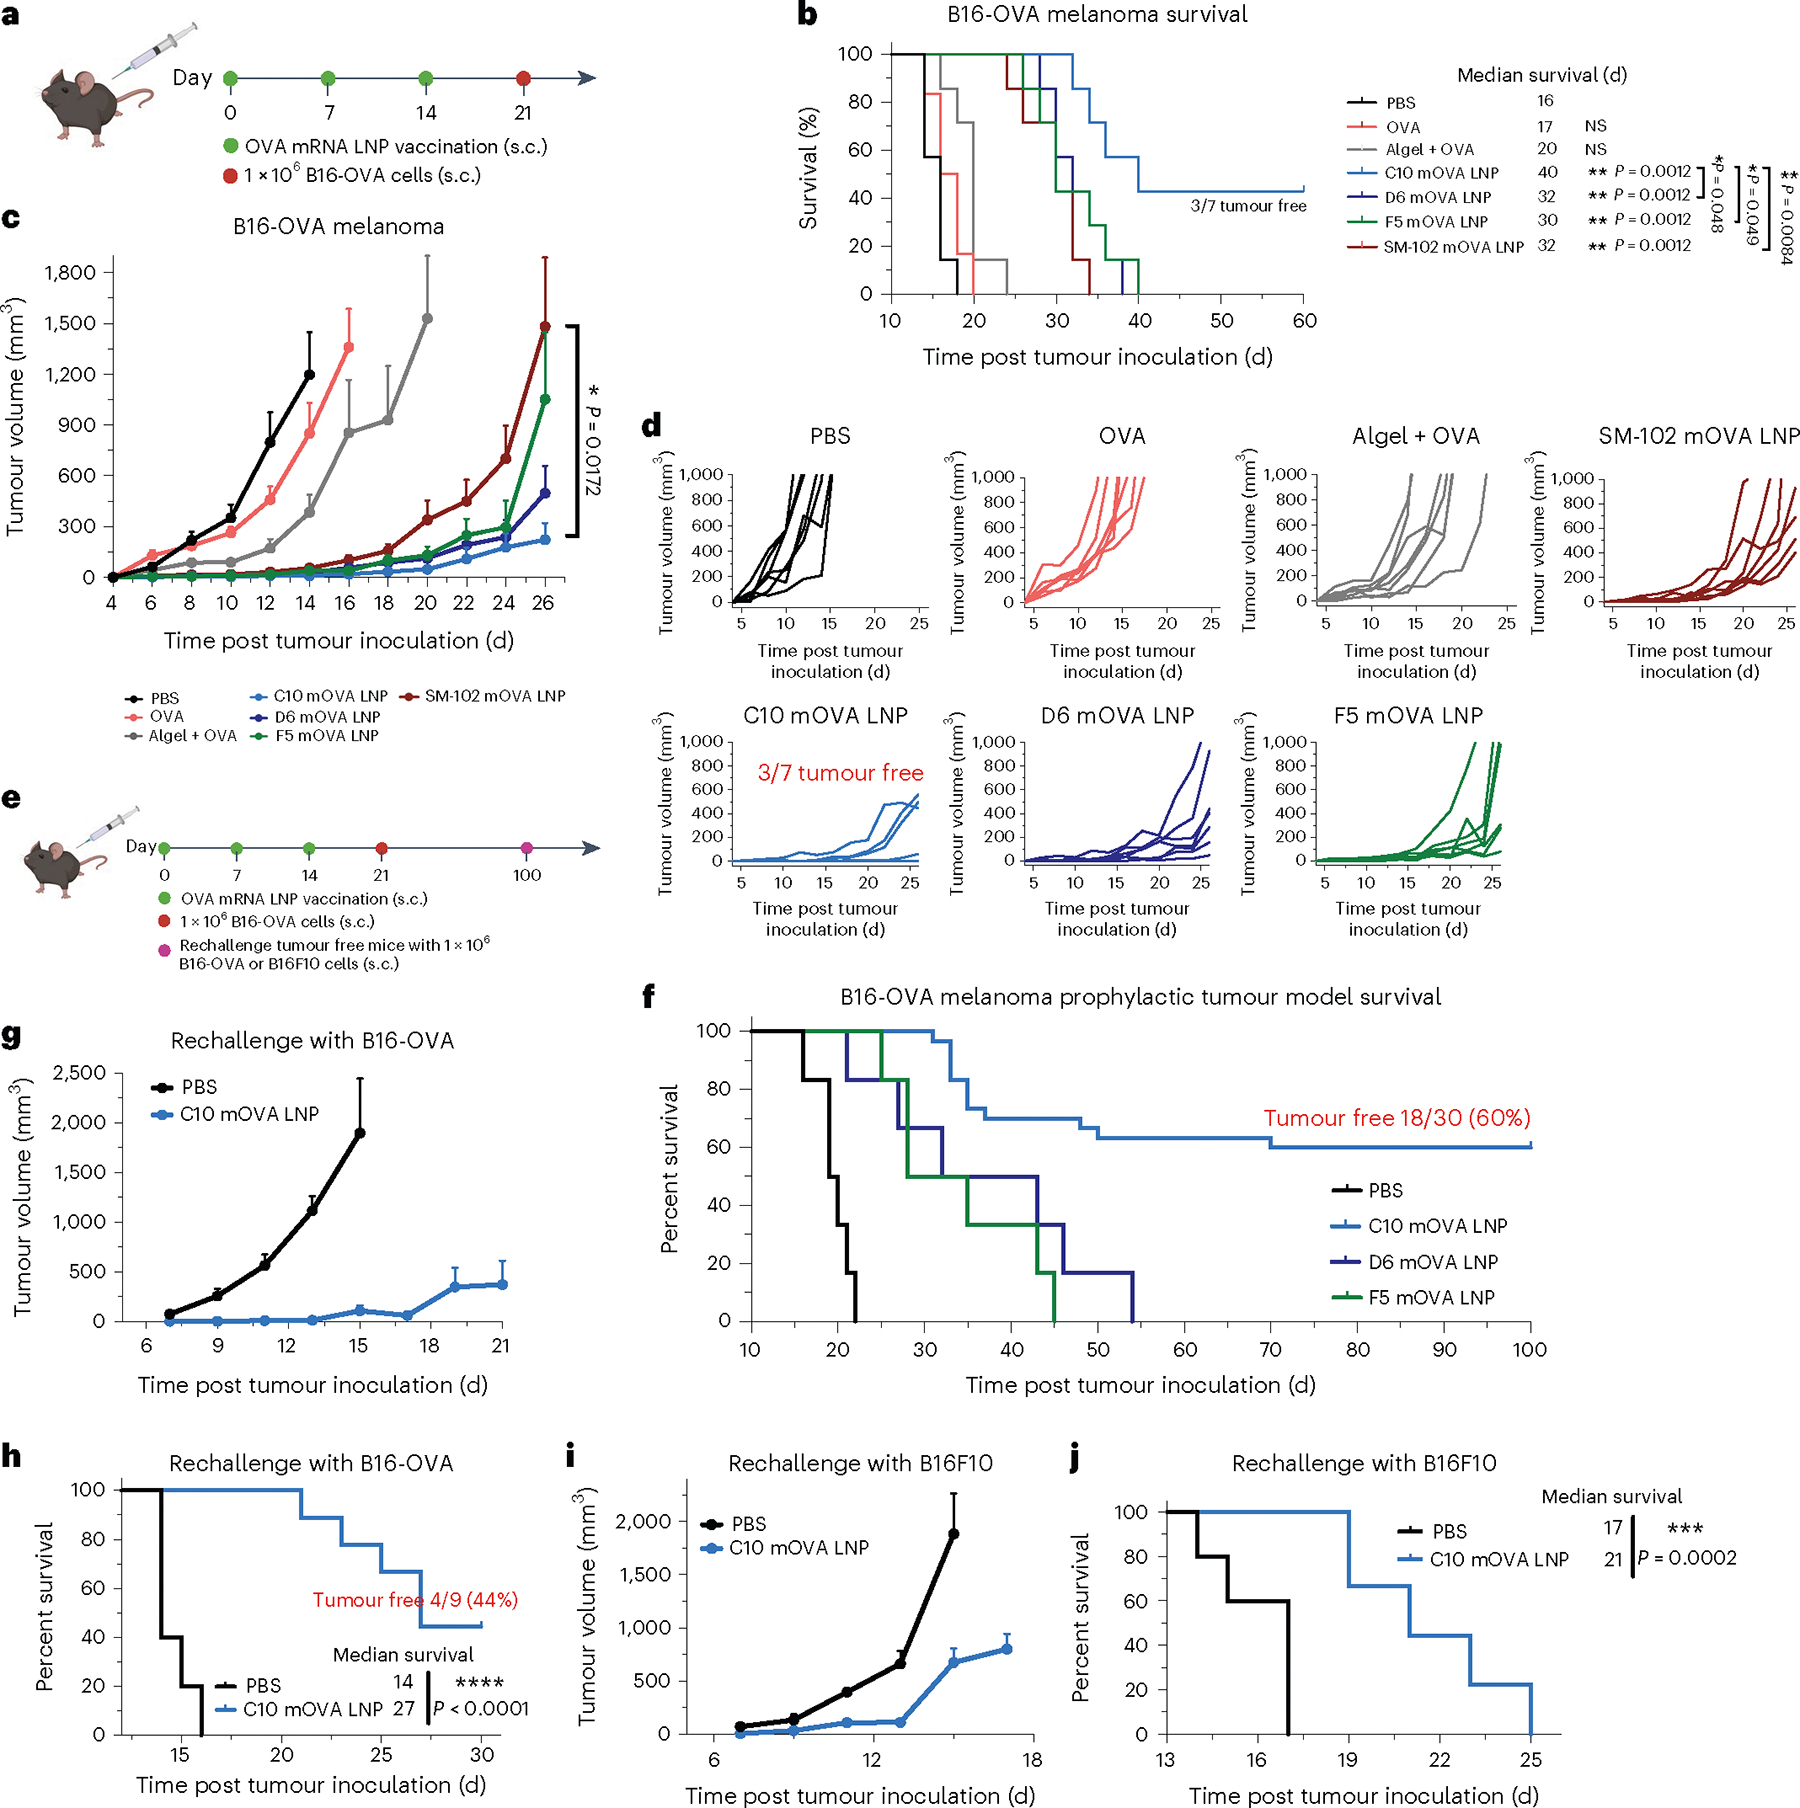
Fig. 3 |. Antitumour efficacy of top mRNA LNP formulations as prophylactic vaccines.

a–d, Schematic and results of a prophylactic vaccination model for OVA-expressing melanoma in C57BL/6 mice. Mice were given three s.c. injections (10 μg mOVA per injection), 1 week apart, of PBS, free OVA protein, OVA protein mixed with Alhydrogel (1:1) or mOVA-loaded C10, D6, F5 or SM-102 LNPs before s.c. inoculation of OVA-expressing melanoma (B16-OVA) cells (a). Survival curves (b), average tumour volume (c) and individual tumour volume (d) over time are shown. e–j, Schematic and results of a prophylactic vaccination and rechallenge model for B16-OVA in C57BL/6 mice. Mice were vaccinated as described above before s.c. inoculation of OVA-expressing melanoma (B16-OVA) cells. After 100 d, the tumourfree mice were rechallenged with either B16-OVA or B16F10 cells, and mice at a similar age were included as a control group injected with PBS (e). Survival curves (f,h,j) and average tumour volume (g,i) are shown. In b–d, data represent mean ± s.e.m. from a representative experiment (n = 7 biologically independent samples) of two independent experiments. In f, data represent mean ± s.e.m.; n = 30 for the C10 mOVA LNP group and for other groups, n = 6 biologically independent samples. In g–j, data represent mean ± s.e.m.; n = 9 biologically independent samples for the C10 mOVA LNP group and n = 5 for the PBS control group. Differences between treatment groups were analysed using one-way ANOVA and Tukey’s multiple comparisons test. Survival curves were compared using log-rank Mantel–Cox test, and the stack of P values were corrected using the Holm-Šídák method for multiple comparisons with α set at 0.05. *P < 0.05, **P < 0.01, ***P < 0.001, ****P < 0.0001.
