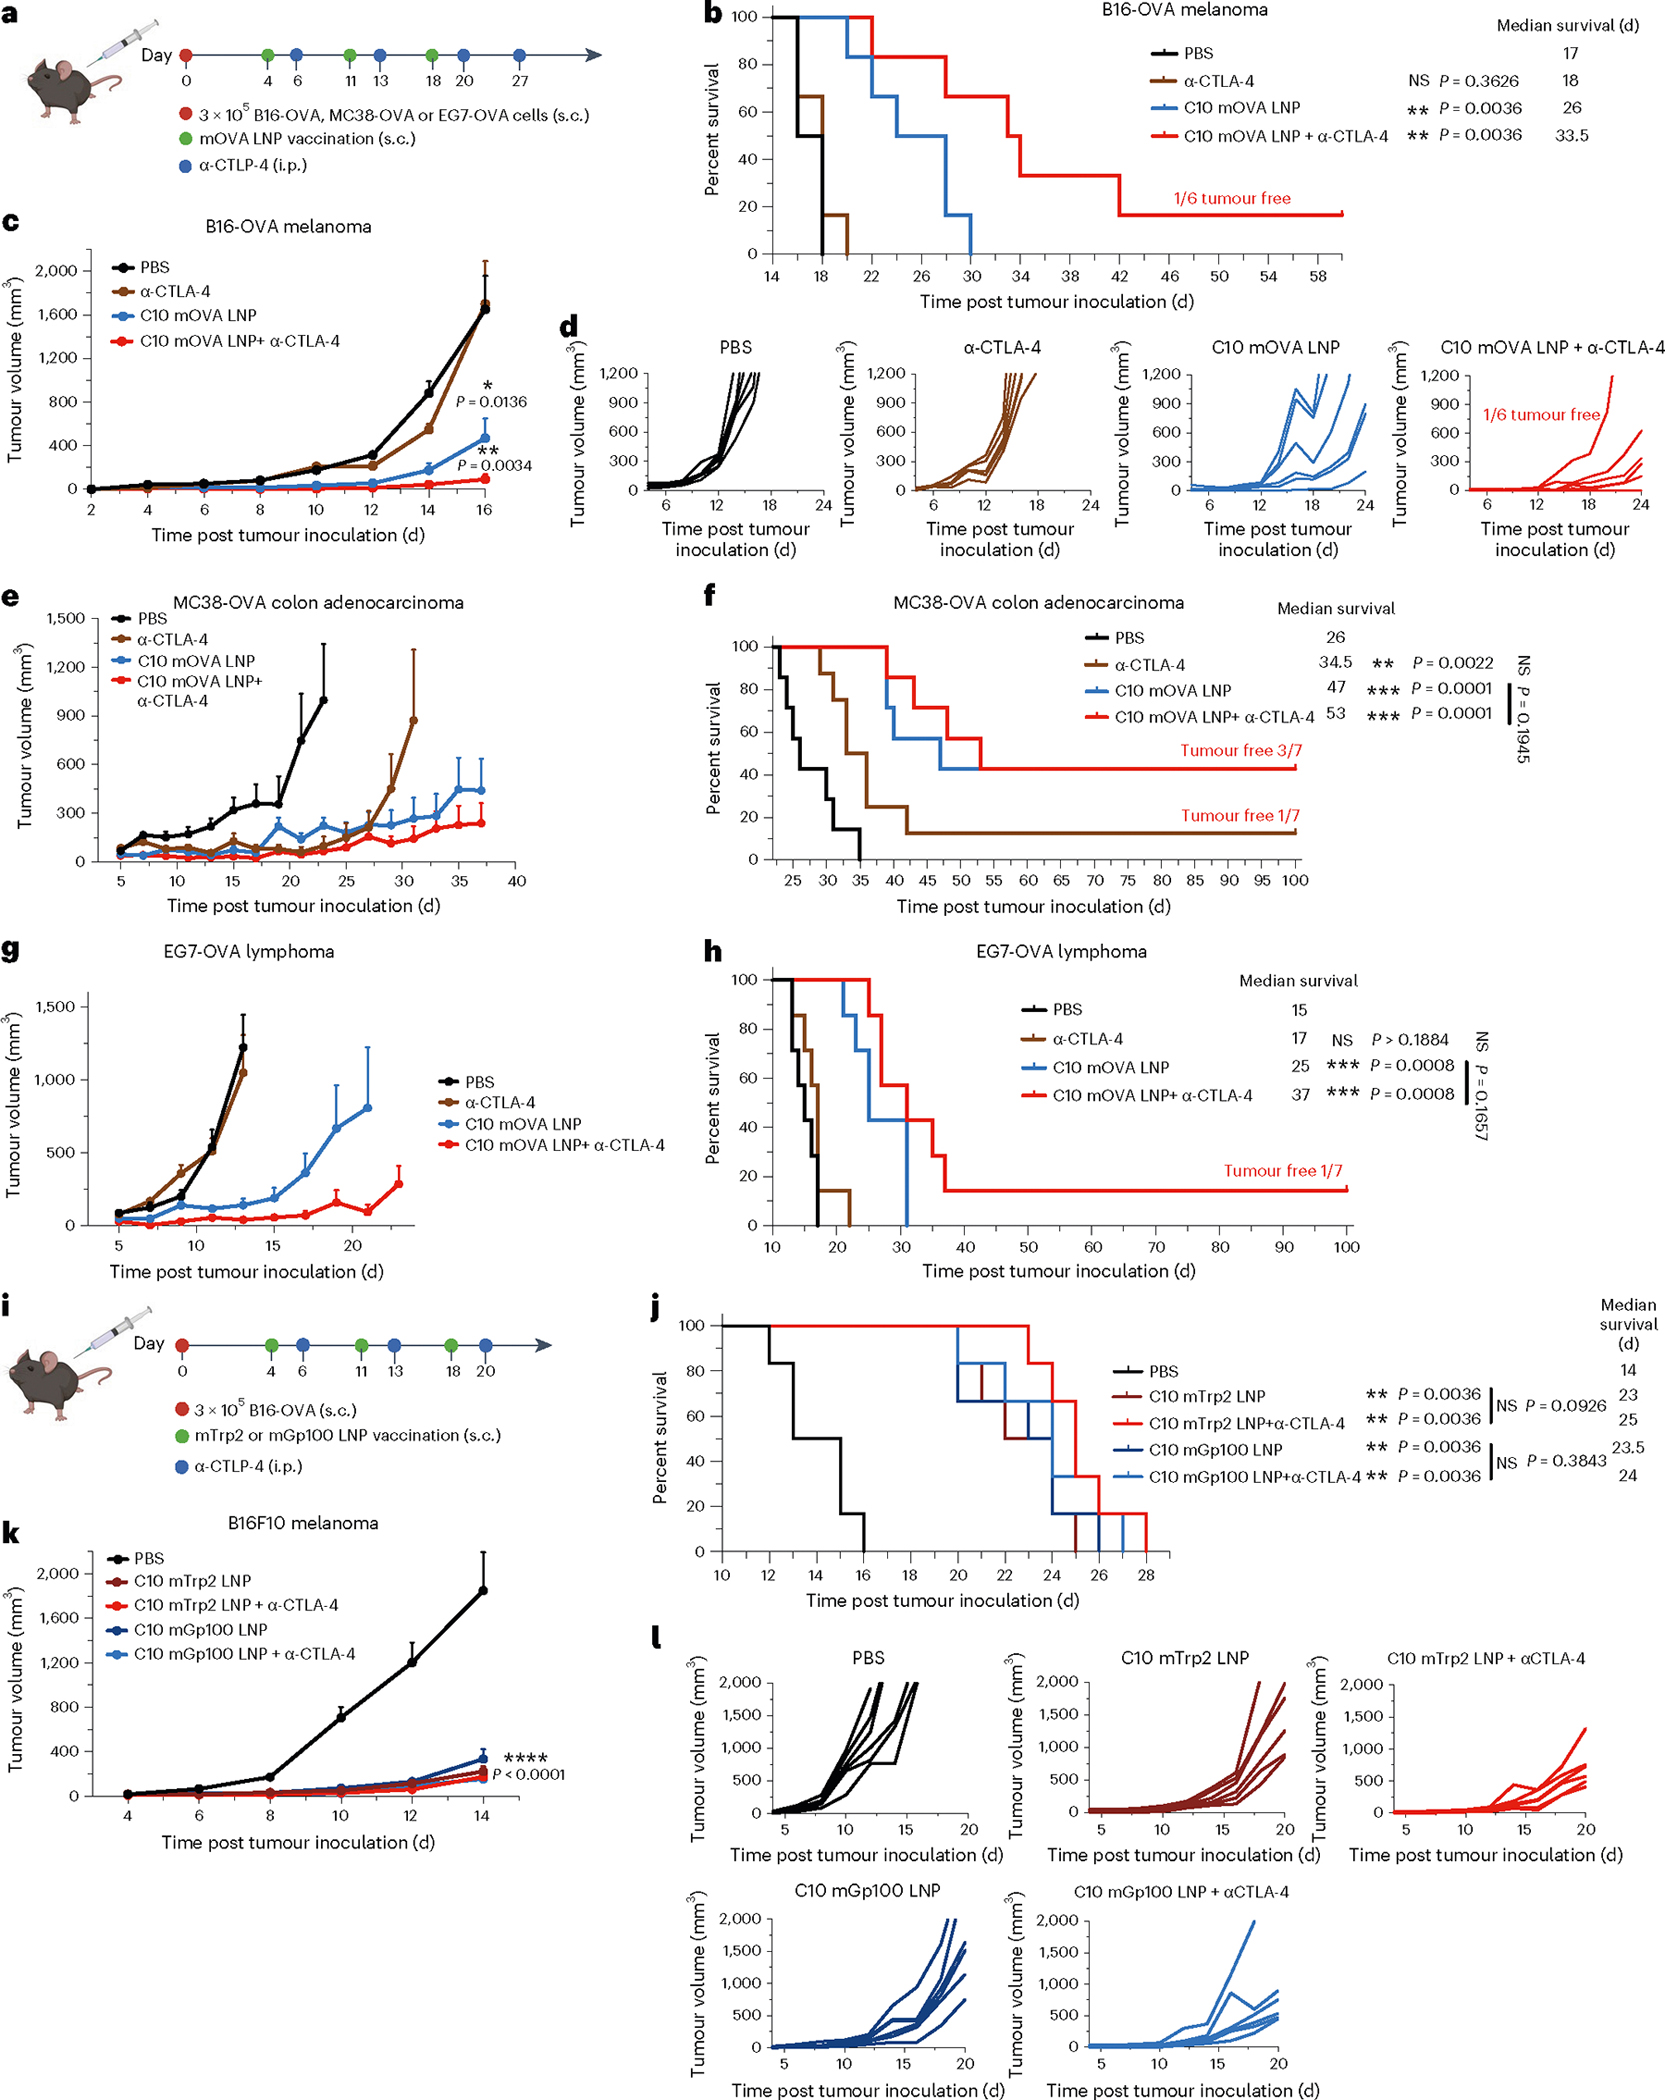
Fig. 4 |. Antitumour efficacy of the top mRNA LNP formulations as therapeutic vaccines.

a–h, Schematic and results of a therapeutic vaccination model for B16-OVA, MC38-OVA and EG7-OVA in C57BL/6 mice. Mice were inoculated s.c. with B16-OVA, MC38-OVA or EG7-OVA cells and then given three s.c. injections, 1 week apart, of mOVA-loaded C10 (10 μg mOVA per injection) or PBS. Two groups received a repeated anti-CTLA-4 mAb (100 μg per i.p. injection) treatment alone or in combination with the LNPs (a). Survival curves (b,f,h), average tumour volumes (c,e,g) and individual tumour volumes (d) are shown. i–l, Schematic and results of a therapeutic vaccine against melanoma-associated antigens for melanoma in C57BL/6 mice. Mice were inoculated s.c. with B16F10 cells and then given three s.c. injections, 1 week apart, of PBS or C10 LNP loaded with mRNA encoding Trp2 (mTrp) or Gp100 (mGp100) (10 μg mRNA per injection). Two groups received the anti-CTLA-4 mAb (100 μg per i.p. injection) treatment in combination with LNP treatment (i). Survival curves (j), average tumour volumes (k) and individual tumour volumes (l) are shown. Data represent mean ± s.e.m. with n = 7 (e–h) and n = 6 (a–d, i–l) biologically independent samples. Differences between treatment groups were analysed using one-way ANOVA and Tukey’s multiple comparison tests. Survival curves were compared using log-rank Mantel–Cox test and P values were corrected using the Holm-Šídák method for multiple comparisons with α set at 0.05. *P < 0.05, **P < 0.01, ***P < 0.001, ****P < 0.0001; αCTLA-4, anti-CTLA-4 mAb.
