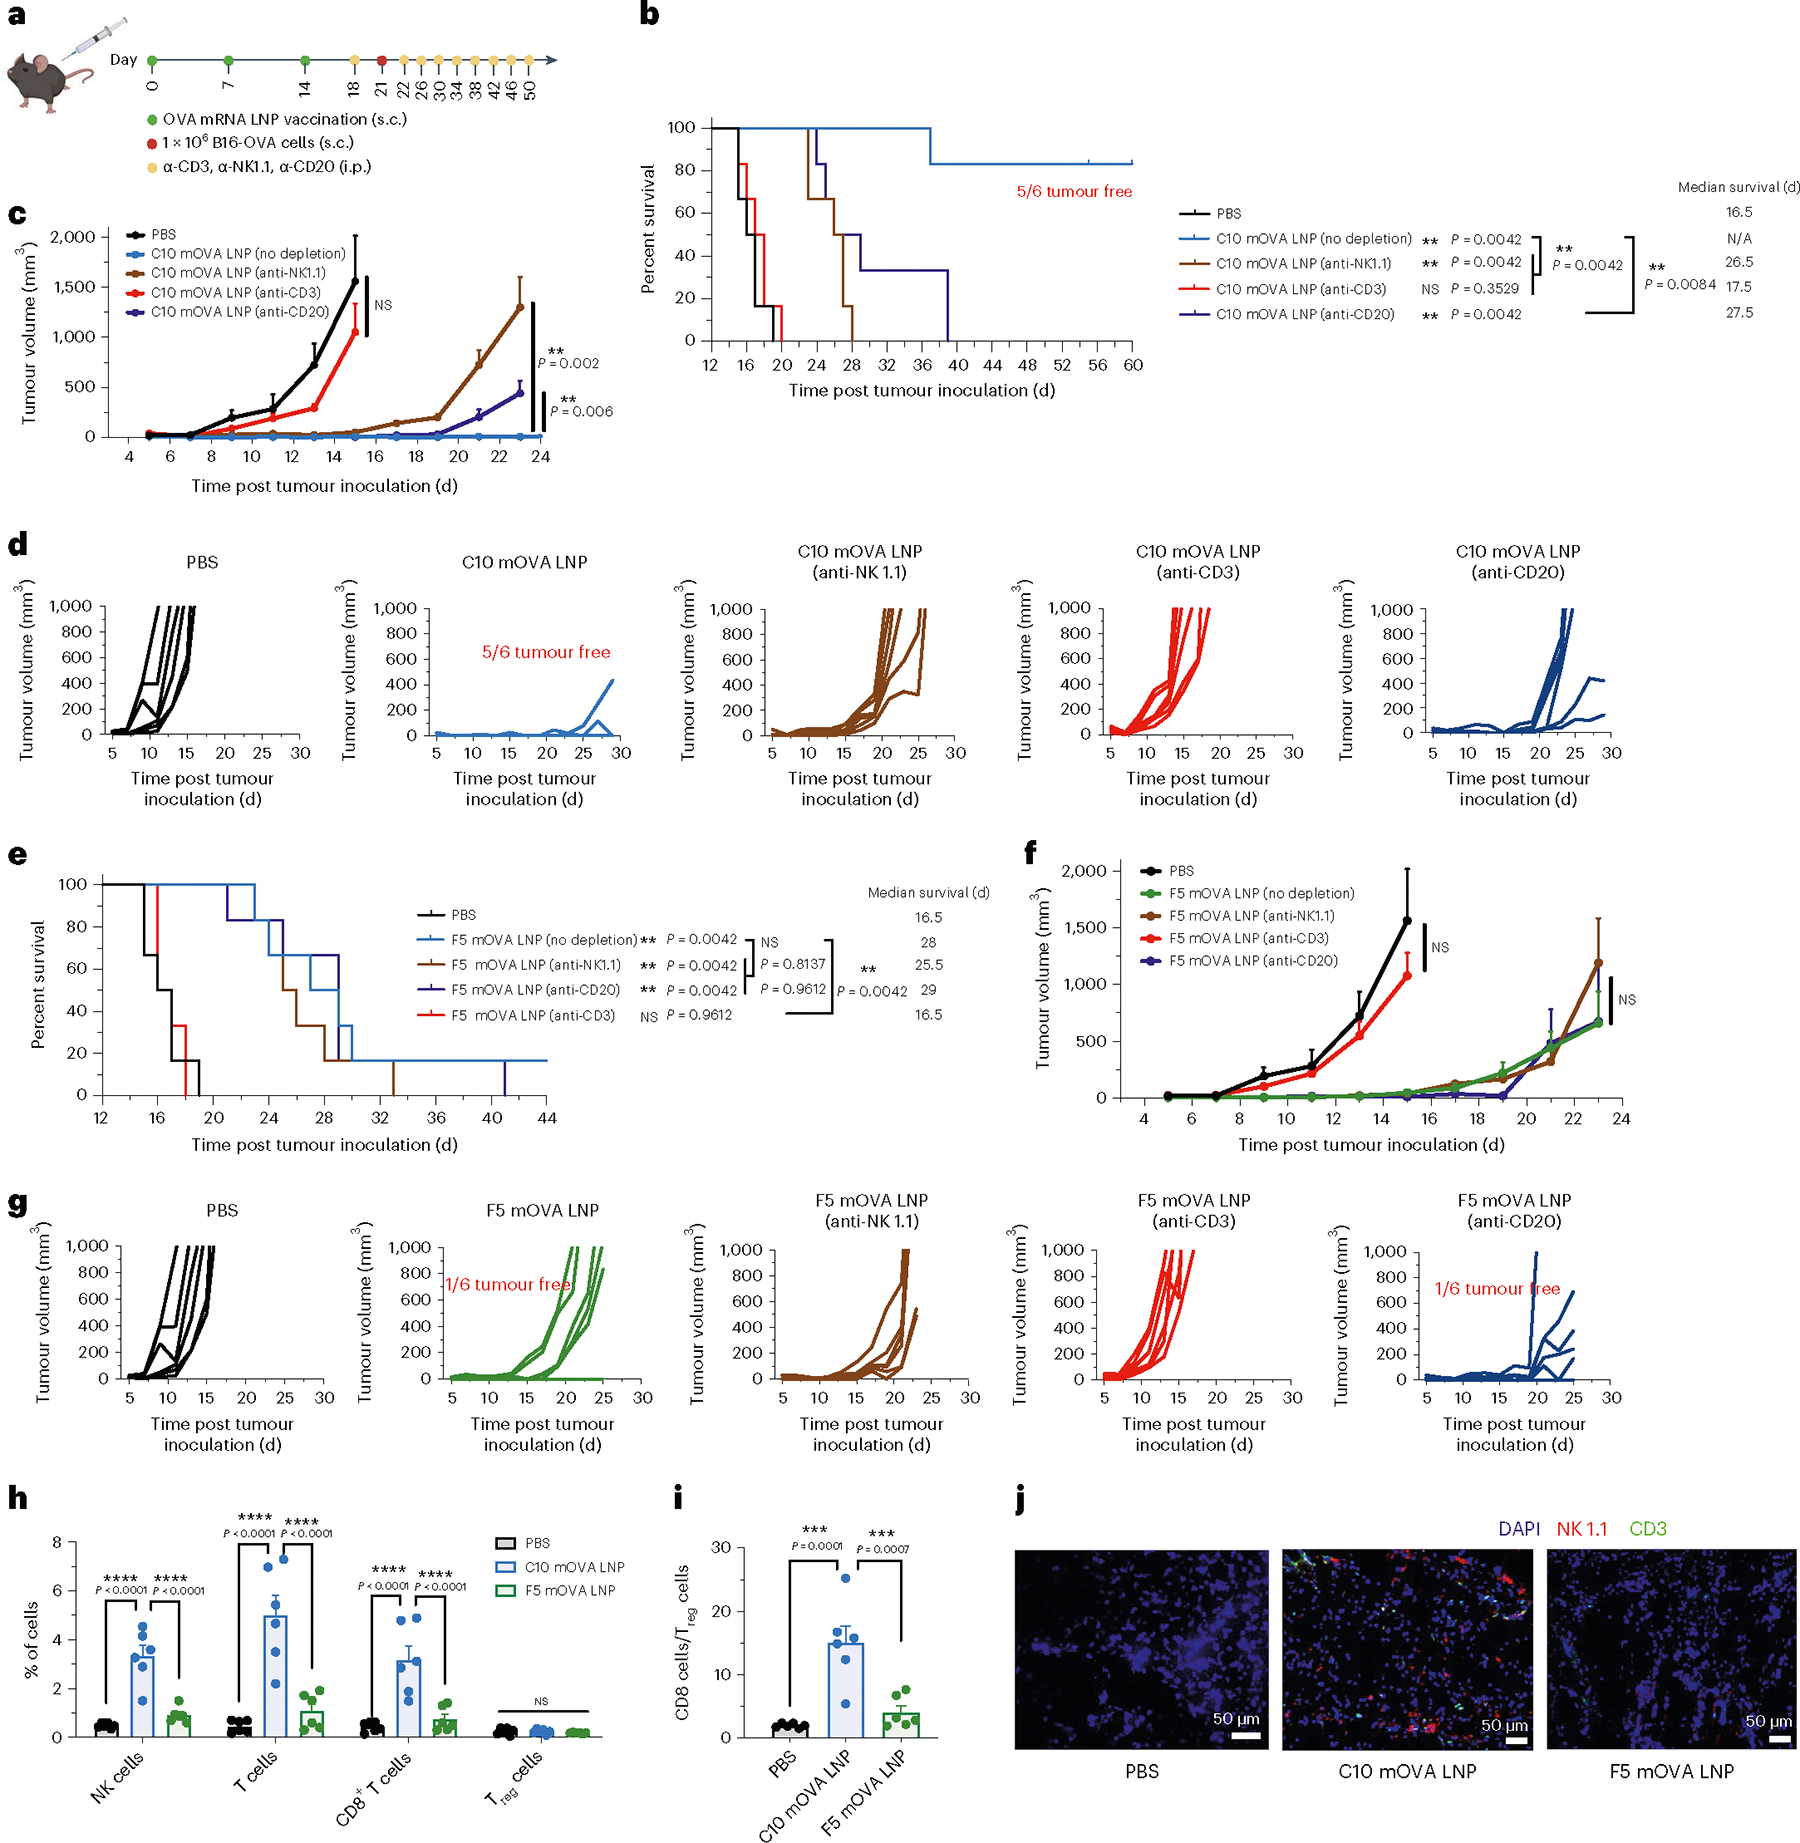
Fig. 5 |. A coordinated attack by T cells and NK cells was responsible for long-term protection.

a–g, Schematic and results of cell depletion experiments in the prophylactic vaccination model for OVA-expressing melanoma in C57BL/6 mice. Mice were given three s.c. injections, 1 week apart, of PBS or mOVA-loaded C10 or F5 LNPs (10 μg mOVA per injection) before s.c. inoculation of B16-OVA cells, and antibody for cell depletion were injected every 4 d (i.p., 200 μg per mice) (a). Survival curves (b,e), average tumour volumes (c,f) and individual tumour volumes (d,g) over time are shown (n = 6 biologically independent mice per group). h, Tumour-infiltrating immune cells including NK cells, T cells, CD8+ T cells and Treg cells were determined by flow cytometry on day 22 post tumour inoculation (n = 6 per group). i, Ratio of CD8+ T cell percentage to CD4+FoxP3+CD25+ Treg cell percentage on day 22 post tumour inoculation (n = 6 per group). j, Immunofluorescent analysis of CD3 T cell and NK-cell infiltration of tumour section on day 22 post tumour inoculation. Blue, DAPI; green, CD3; red, NK 1.1. Data represent the mean ± s.e.m. Differences between treatment groups were analysed using one-way ANOVA and Tukey’s multiple comparisons test. Survival curves were compared using log-rank Mantel–Cox test and P values were corrected using the Holm-Šídák method for multiple comparisons with α set at 0.05. **P < 0.01, ***P < 0.001, ****P < 0.0001.
