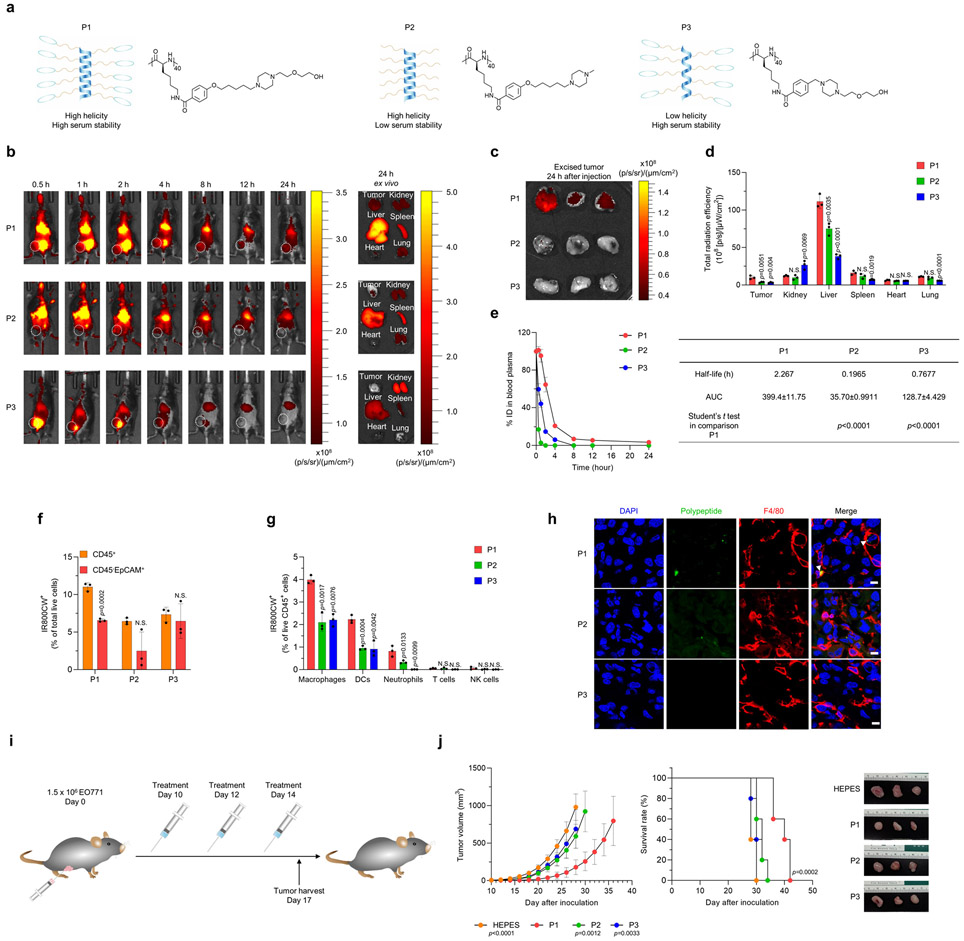
Fig. 1. Physiochemical characterization and antitumor evaluation of polypeptides in vivo.
(a) Schematic illustration and chemical structure of the P1, P2, and P3 polypeptides. (b) Representative fluorescence images of EO771 tumor-bearing mice taken at predetermined times after intravenous injection of IR800CW-tagged P1, P2, or P3 (10 mg/kg), and ex vivo fluorescence images of tumor and major organs harvested at 24 h after administration. (c) Fluorescence images of EO771 tumor tissues excised at 24 h after treatment with IR800CW-tagged P1, P2 or P3. (d) Quantification of total radiation efficiency (near infrared fluorescence signal) of tumor and major organs at 24 h after treatment (n=3, mean±standard deviation, SD); unpaired Student’s t test in comparison with P1. (e) Time course of polypeptide concentrations in blood plasma after intravenous administration of IR800CW-tagged P1, P2, or P3 (10 mg/kg, n=3, mean±SD). Half-life and area under the curve (AUC) values were calculated by GraphPrism. (f, g) Measurement of IR800CW+ fluorescence signals in (f) CD45+ cells (leukocytes), CD45− EpCAM+ (EO771 tumor cells), and (g) immune cell subtypes (macrophages: CD11b+CD11c−F4/80+, dendritic cells [DCs]: CD11c+MHC-II+F4/80−, neutrophils: CD11b+CD11c−MHC-II−Gr1+, T cells: CD3+, NK cells: CD3−NKp46+NK1.1+) by flow cytometry of tumors 24 after treatment with IR800CW-tagged P1, P2, or P3 (10 mg/kg). Unpaired two-tailed Student’s t test in comparison with CD45+ for (f) or to P1 for (g). (h) Immunofluorescence images show that IR800CW-tagged P1 accumulates in macrophages and DCs within tumor microenvironments to a greater extent than IR800CW-tagged P2 or P3; scale bar, 15 μm (i) Timeline of treatment with P1, P2, and P3 in EO771 tumor-bearing mice. (j) P1 suppressed tumor growth and extended survival of tumor-bearing mice compared with P2 or P3 (n=5, mean±SD), unpaired Student’s t test in comparison with P1 at day 28 after tumor inoculation for tumor growth curves; log-rank (Mantel-Cox) test for Kaplan-Meier survival curves.

