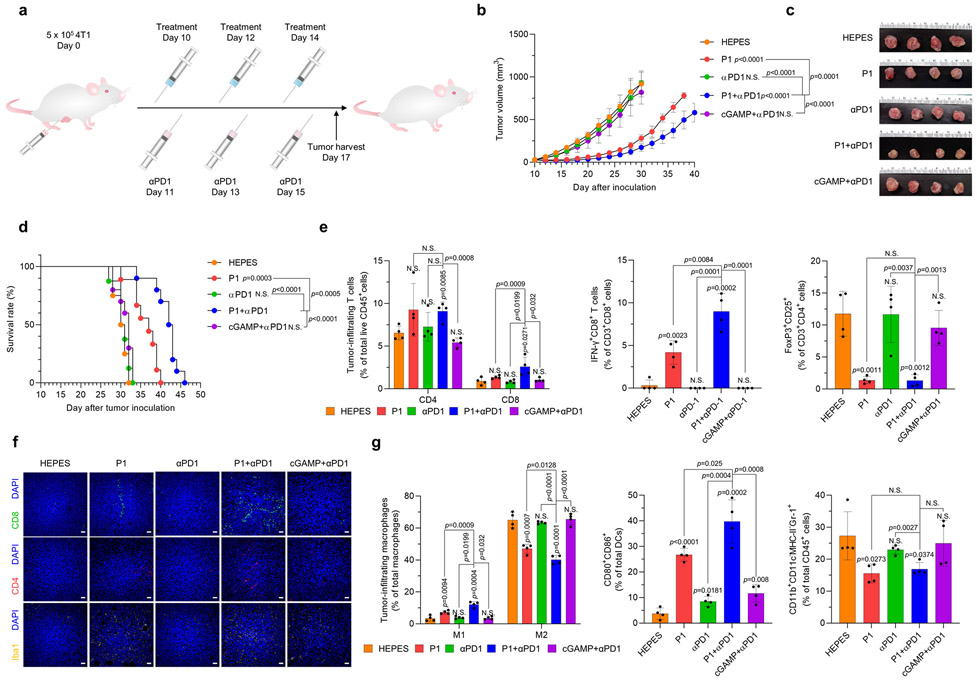
Extended Fig. 5. P1 combined with αPD1 evoked strong antitumor immunity in mice bearing metastatic tumors.
(a) Timeline for tumor establishment and administration of P1 and αPD1. (b) Growth curves for 4T1 tumors in mice after the indicated treatments (n=8 for HEPES; n=9 for P1; n=10 for P1+αPD1 and cGAMP+αPD1; mean±SD), unpaired Student’s t test in comparison with HEPES or the indicated conditions on day 30 after tumor inoculation. (c) Photographs of excised 4T1 tumor tissues on day 17. (d) Kaplan-Meier survival curves of 4T1 tumor-bearing mice; log-rank (Mantel-Cox) test in comparison with HEPES or the indicated conditions. (e) Flow cytometry of tumor-infiltrating T lymphocytes (Tregs: CD3+CD4+CD25+FoxP3+) and their subsets (n=4, mean±SD), which were harvested on day 17. (f) Immunofluorescence stains for CD4, CD8, and Iba1 in macrophages (scale bar, 30 μm). (g) Profiles of tumor-infiltrating myeloid cells (M1 macrophage: CD206−CD80+CD86+; M2 macrophage: CD206+CD80−; macrophage: CD11b+CD11c−F4/80+MHC-II; mature DC: CD80+CD86+ DC; DC: CD11c+MHC-II+F4/80−; MDSC: CD11b+CD11c−MHC-II−F4/80−Gr-1+) as evaluated by flow cytometry (n=4, mean±SD); unpaired Student’s t test in comparison with Cont or the indicated condition.

