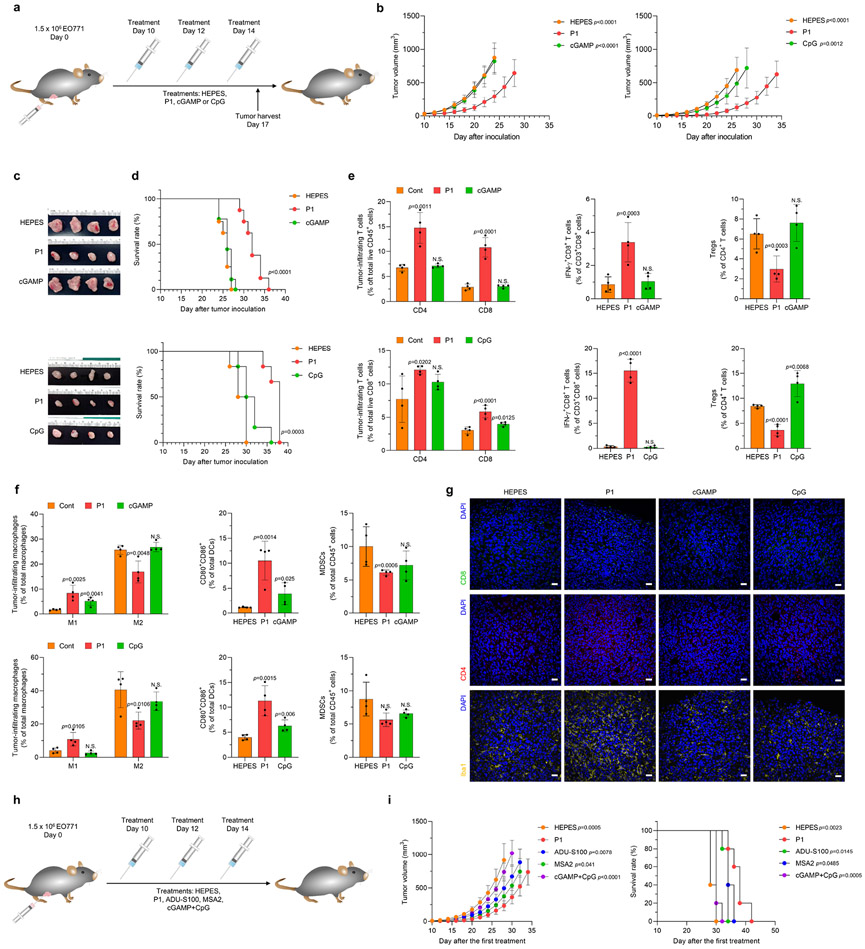
Fig. 2. P1 inhibits tumor growth and extends survival in tumor-bearing mice.
(a) Timeline of intravenous treatments (10 mg/kg for P1, cGAMP, and CpG). (b) Growth curves for EO771 tumors in mice after the indicated treatments. (For tumor inhibition study with HEPES, P1, and cGAMP: n=8 biologically independent mice for each group; unpaired Student’s t test in comparison to P1 at day 24 after tumor inoculation. For tumor inhibition study with HEPES, P1, and CpG: n=6 biologically independent mice for each group; unpaired Student’s t test in comparison to P1 at day 26 after tumor inoculation, mean±SD). (c) Tumor tissues from each treatment group were excised 2 days after the last treatment. (d) Kaplan-Meier survival curves of EO771 tumor-bearing mice show that P1 extended survival; log-rank (Mantel-Cox) test. (e) P1 increased tumor-infiltrating T cells and IFN-γ+CD8+ T cells but reduced Tregs (Foxp3+CD25+CD4+ T cells) (n=4, mean±SD). Tumor-infiltrating lymphocytes were harvested 2 days after the last treatment. (f) Flow cytometry of tumor-infiltrating M1 (CD80+CD86+CD206−) and M2 (CD80−CD206+) macrophages (CD11b+CD11c−F4/80+MHC-II−), DCs (CD11c+F4/80−MHC-II+) and MDSCs (CD11b+CD11c−F4/80−MHC-II−Gr-1+) show that P1 activated innate immune responses in the tumor microenvironment (n=4, mean±SD); unpaired Student’s t test in comparison to Cont. (g) Immunohistological staining of tumor tissues stained for CD4+, CD8+, and Iba1+ (scale bar, 30 μm). (h) Timelines for systemic treatments [10 mg/kg for P1, ADU-S100 (a synthetic STING agonist with thiol esters), MSA-2 (non-nucleotide STING agonist); or 10 mg/kg cGAMP+10 mg/kg CpG for cGAMP+CpG]. (i) P1 treatment suppressed tumor growth and increased survival period of EO771 tumor-bearing mice to a comparable extent as MSA-2 and to a greater extent than the other treatments (n=5, mean±SD), Student’s t test in comparison with P1 at Day 26 after tumor inoculation for tumor growth curves; log-rank (Mantel-Cox) test in comparison with P1.

