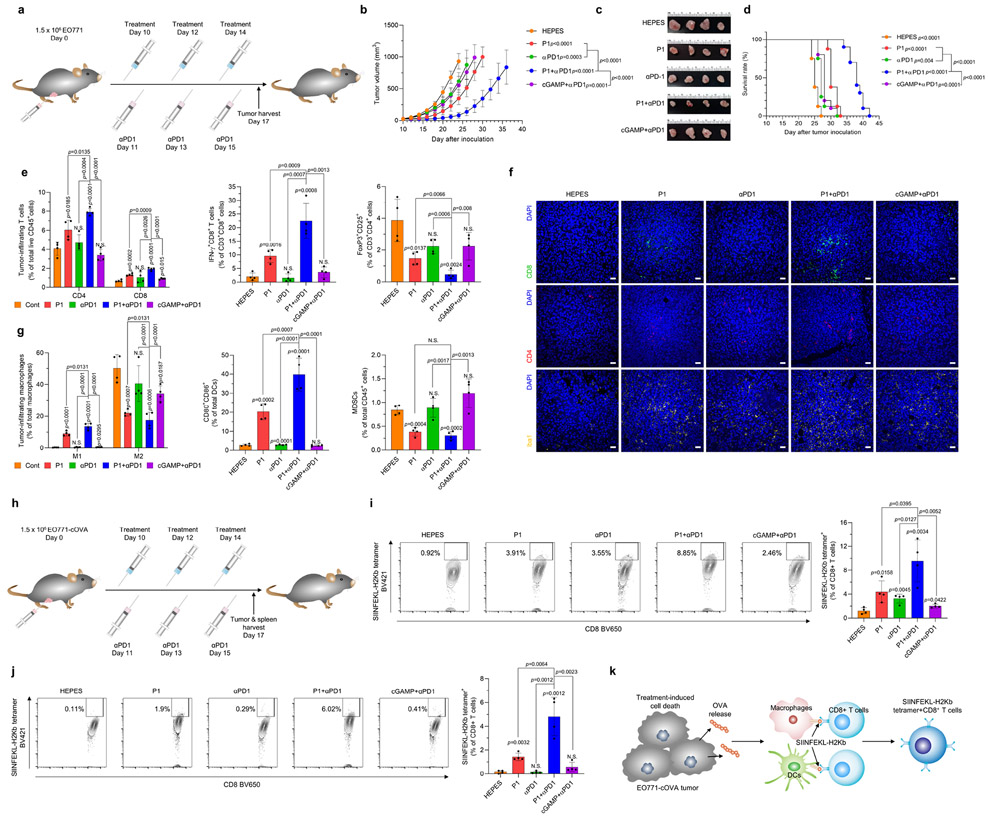
Fig. 5. P1 in combination with αPD1 has synergistic antitumor effects.
(a) Timeline for tumor establishment and administration of HEPES, P1, αPD1, P1+αPD1, and cGAMP+αPD1. (b) Growth curves for EO771 tumors from mice after the indicated treatments (n=8 for HEPES, P1, αPD1; n=10 for P1+αPD1, cGAMP+αPD1, mean±SD), unpaired Student’s t test in comparison with HEPES or the indicated conditions at Day 24 after tumor inoculation. (c) Excised tumor tissues on day 17 from each group. (d) P1+αPD1 combination treatment prolonged survival in EO771 tumor-bearing mice; log-rank (Mantel-Cox) test in comparison to HEPES or the indicated conditions. (e) P1+αPD1 increased the population of tumor-infiltrating T cells and interferon (IFN)-γ+CD8+ T cells along with reducing the population of Tregs, as evaluated by flow cytometry (n=4, mean±SD). (f) Immunofluorescence stains of tumor-infiltrating T cells and Iba1+ cells show that the combination treatment modulated the tumor microenvironments; scale bar, 30 μm. (g) P1+αPD1 combination treatment promoted M1 macrophage polarization and maturation of DCs while decreasing the population of MDSCs, as verified by flow cytometry (macrophages: CD11b+CD11c−F4/80+ MHC-II−, DCs: CD11c+F4/80−MHC-II+, MDSCs: CD11b+CD11c−F4/80−MHC-II−Gr-1+, M1: CD80+CD86+CD206− macrophages, M2: CD80−CD206+ macrophages) (n=4, mean±SD). Unpaired Student’s t test in comparison to ‘Cont’ or the indicated condition. (h) Timeline for tumor inoculation with EO771-cOVA and the indicated treatments. P1+αPD1 increased SIINFEKL-H2Kb tetramer+CD8+ T cells (i) within the tumor microenvironment and (j) in spleen (n=4, mean±SD); unpaired Student’s t test in comparison with HEPES or the indicated conditions. (k) Schematic illustrating the mechanism of SIINFEKL-H2Kb tetramer+ CD8+ T cell expansion

