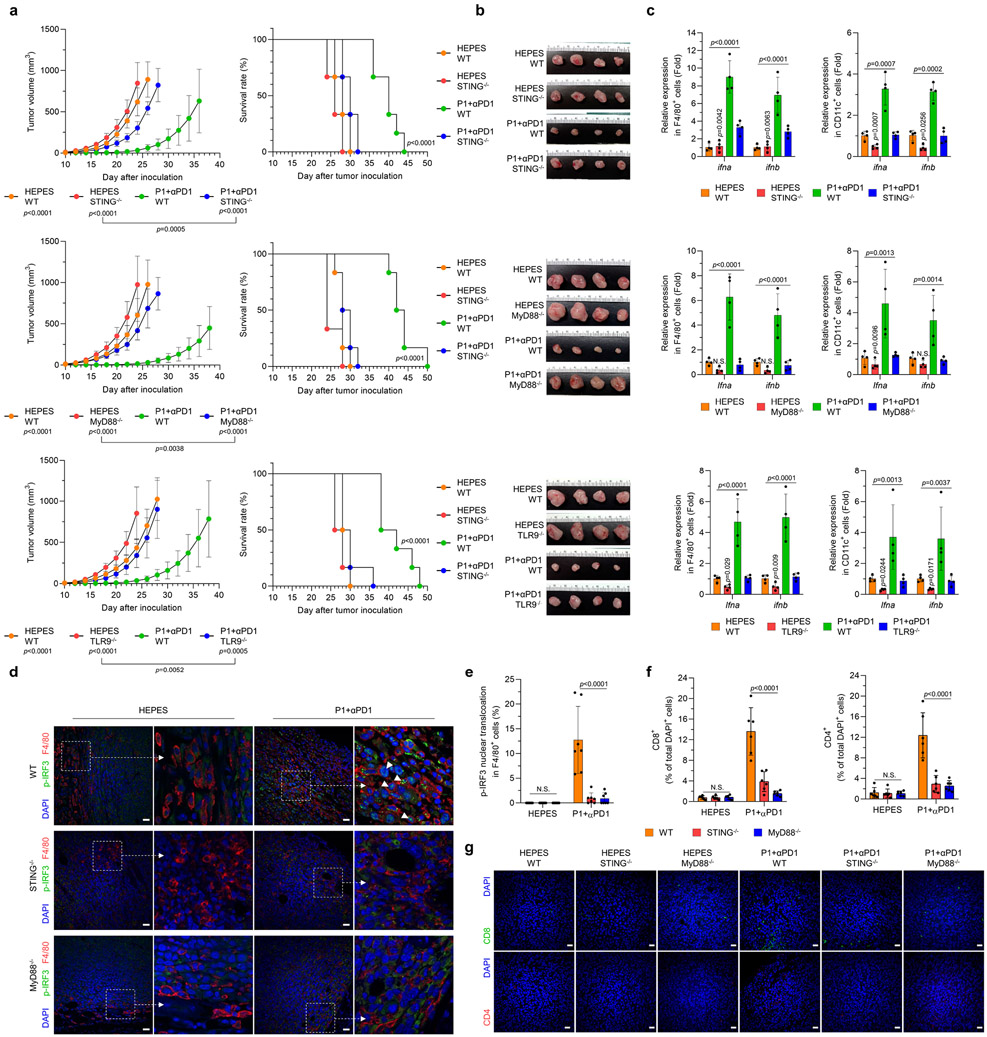
Fig. 6. Activation of STING and TLR9-MyD88 is essential for P1+αPD1–induced immune responses.
(a) Knockout of STING, MyD88, and TLR9 abrogated the antitumor effect of combined P1+αPD1 treatment and curtailed survival of EO771 tumor-bearing mice (n=6 for all experimental arms except for P1+αPD1 WT [n=8] in studies of tumor inhibition, mean±SD); unpaired Student’s t test in comparison with P1+αPD1 WT or the indicated conditions at day 24 after tumor inoculation for tumor growth graphs; log-rank (Mantel-Cox) test for Kaplan-Meier survival curves. (b) Harvested tissues from WT, STING−/−, MyD88−/−, or TLR9−/− tumors on day 16 after treatment with HEPES or P1+αPD1. (c) P1+αPD1 increased the production of ifna and ifnb in tumor-homing macrophages (F4/80+) and in tumor-homing DCs (CD11c+) by stimulating STING and TLR9-MyD88 (n=4, mean±SD); ordinary one-way ANOVA or unpaired Student’s t test in comparison with P1+αPD1 knockout mouse strains. (d) Immunofluorescence images show that P1+αPD1 promoted phosphorylation of IRF3 (p-IRF3) and its nuclear translocation (white arrow) in tumor-homing macrophages by activating STING and MyD88; scale bar, 30 μm. (e,f) Quantification of nucleus-translocating (e) p-IRF3+ macrophages and (f) tumor-infiltrating CD4+ and CD8+ T cells (n=7 independent images for p-IRF3, n=6 independent images for CD4 and CD8, mean±SD); ordinary one-way ANOVA. (g) Immunofluorescence staining of CD8+ and CD4+ T cells in EO771 tumors from WT, STING−/−, and MyD88−/− mice; scale bar, 30 μm. Cells shown in the immunofluorescence images were counted with ImageJ.

