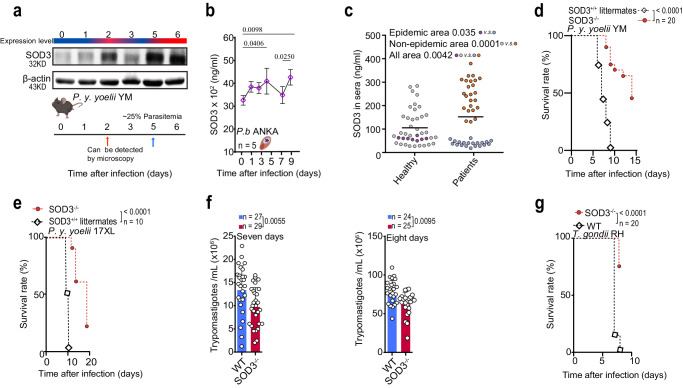
Fig. 1. SOD3 is a host factor associated with host vulnerability to parasite infection.
a Progressively increased expression of SOD3 was observed during P. y. yoelii YM infection. The mouse illustration was created with http://BioRender.com (publishing license: CZ26UIGFUP). b Serum SOD3 expression was elevated in mice after infection with P. berghei ANKA, with peaks observed after 5 days and 9 days. Five biological replicates were included in the analysis; healthy controls were three biological replicates. Statistical significance tested by one-way ANOVA, and multiple comparisons to each day were corrected using Dunnet’s method. WT mice of average survival time was 9 days from the time of challenge. c SOD3 in the sera of P. falciparum–infected patients from the China-Myanmar border (endemic areas, n = 20), other endemic areas (cases were travel-related, n = 24) and healthy donors (endemic and nonendemic areas, n = 41) as measured by enzyme-linked immunosorbent assay (ELISA). SOD3 levels were significantly elevated in malaria patients from all areas compared with corresponding healthy donors. Two-tailed student’s t test was used to test for significant differences between two groups. d SOD3−/− mice (n = 20) showed significant extended survival time than the WT littermates (n = 20) after P. y. yoelii YM infection. Survived mice in SOD3−/− group were humanely euthanized accordingly to the Institutional Animal Care and Use Committee-approved criteria. e Knockout of SOD3 extended the survival of P. y. yoelii 17XL-infected mice, n = 10. The survived mice in SOD3−/− group were humanely euthanized accordingly to approved criteria. f Knockout of SOD3 decreased parasitemia in both seven and eight days after T. b. brucei infection. Two-tailed student’s t test was used to test for significant differences between two groups. g Knockout of SOD3 extended the survival of T. gondii-infected mice. The survived mice in SOD3−/− group were humanely euthanized accordingly to approved criteria. Kaplan‒Meier survival curves were calculated using the survival time for each mouse in all groups, and significance was determined by the log-rank test. For d-f, n indicates mouse numbers in graphs. Histograms present the mean ± SD. Source data are provided as a Source Data file.

