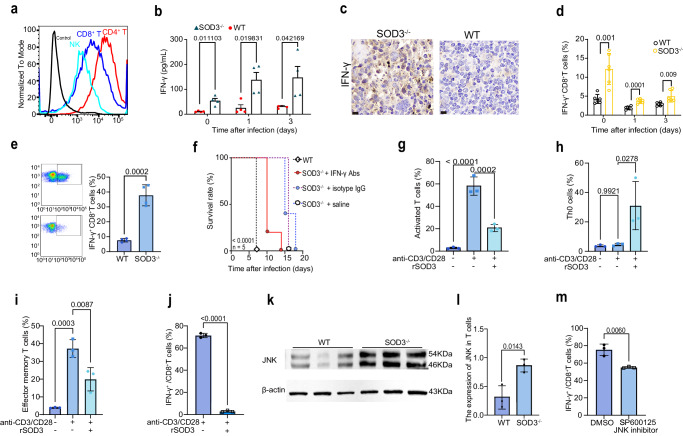
Fig. 3. SOD3 bound T cells and suppressed the IFN-γ response to parasite infection.
a SOD3 can bind both T cells and NK cells. Black line indicates the blank control, and the gray line represents omission of the primary antibody as the negative control. The Alexa Fluor™ 488-conjugated goat anti-Rabbit IgG (H + L) secondary antibody was used to recognize the primary antibody. The control sample was stained with a non-specific rabbit IgG as the primary antibody and AF488-goat anti-rabbit IgG secondary antibody. b Depletion of SOD3 in mice rescued the IFN-γ production in the sera (n = 4). c The expression of IFN-γ protein in the splenic cells of SOD3−/− mice was much more than that of WT mice after infection illustrated by immunohistochemistry. Scale bar =20 µm. d, e The proportion of IFN-γ-expressing CD8+ T cells was significantly enhanced in SOD3−/− mice infected with P. y. yoelii (yellow bar). n = 6 (d); n = 3 (e). f Depletion of IFN-γ in mice resulted in early death in SOD3−/− mice after P. berghei ANKA infection. Five biological replicates were included in the analysis. Kaplan‒Meier survival curves were calculated using the survival time for each mouse in all groups, and significance was determined by the log-rank test. g SOD3 inhibited T cell activation (n = 3). h, i SOD3 inhibited the differentiation of Th0 cells (naïve T cells) into effector cells in in vitro experiments (n = 3). j The proportion of IFN-γ-expressing CD8+ T cells upon stimulation with SOD3 was significantly reduced in in vitro experiments (n = 3). k, l Western blot and quantitative for JNK and β-actin in cell lysates obtained from T cells sorted from SOD3−/− and WT mice after infection. The expression of JNK in T cells was significantly lower in WT mice than that in the SOD3−/− mice. Representative immunoblot using antibodies against β-actin and JNK1/2/3 (n = 3). m Treatment with SP600125, a selective JNK inhibitor, led to a decrease in the proportion of IFN-γ-expressing CD8+ T cells (n = 3). t-test two-sided was used to compare change in (b, d, e, g–j, l, m). Histograms present the mean ± SD. Source data are provided as a Source Data file.

