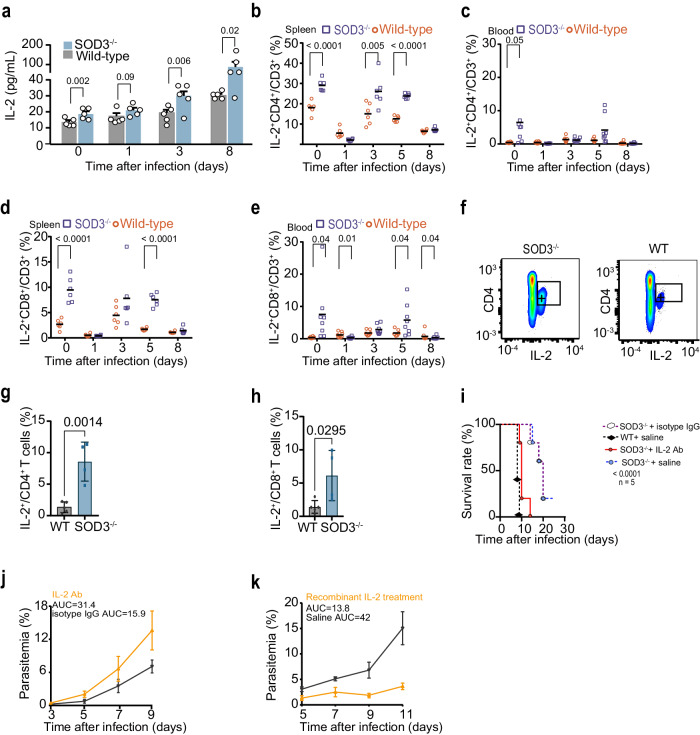
Fig. 4. SOD3 suppresses IL-2 expression in T cells and immune resistance in Plasmodium infection.
a IL-2 levels in mouse sera were gradually elevated in SOD3−/− compared with WT mice after infection by P. berghei ANKA (n = 5). b–e Statistical analysis of IL-2 production in splenic and circulating CD4+ and CD8+ cells from both WT and SOD3−/− mice (n = 6–8) at different time points after P. berghei infection. f Representative flow cytometry plots of splenic IL-2+ CD4+ T cells in both SOD3−/− mice and WT mice. g, h Statistical analysis of IL-2 production in CD4+ and CD8+ T cells from both WT (n = 5) and SOD3−/− mice (n = 4) after P. y. yoelii infection. i, j Neutralization of IL-2 in SOD3−/− mice resulted in early death and higher parasitemia after P. berghei infection compared to control mice. Five biological replicates were included in the analysis. Parasitemia was depicted with the area under curve (AUC). The survived mice in SOD3−/− +saline group and SOD3−/− +IgG were humanely euthanized accordingly to approved criteria. k Infusion of recombinant IL-2 in WT mice inhibited P. berghei proliferation (n = 5). Parasitemia was depicted with the AUC. Histograms present the mean ± SD. For (a, g, h), Kaplan-Meier survival curve p-values were performed using Log rank Mantel-COX test. Source data are provided as a Source Data file.

