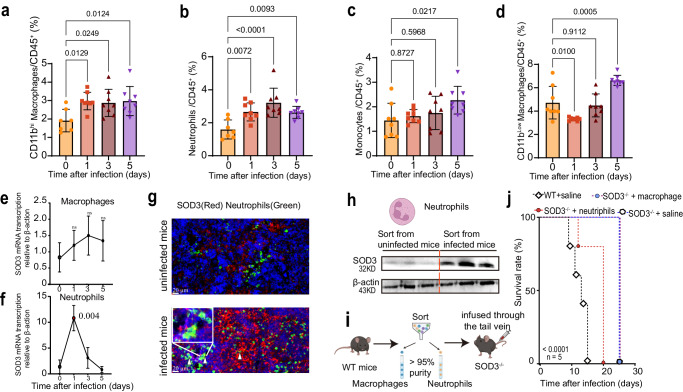
Fig. 6. Neutrophils are the main cell sources of SOD3 in response to parasite infection.
a–d Statistical analysis of CD11bhiF4/80+ monocyte-derived macrophages (a), neutrophils (b), monocytes (c), and CD11blowF4/80+ macrophages (d) from WT mice at different time points after P. berghei ANKA infection. n = 7-8 (a-d) Multiple comparisons test corrected for Tukey was used to test for significant differences between uninfected and infected groups. e, f Transcription of the gene coding for SOD3 was determined by RT–qPCR in neutrophils (e) and macrophages (f) after parasite infection (n = 3). An ~10-fold increase in gene transcription was observed in neutrophils but not in macrophages. Statistical significance tested by one-way ANOVA, and multiple comparisons to the uninfected control were corrected using Dunnet’s method. Three biological replicates were included in the experiment. g Representative high-magnification images of spleen sections of WT mice analyzed with double immunofluorescence for SOD3 (red) and myeloperoxidase (MPO, green). Significant augment of SOD3 expression in the splenic tissue of infected mice was observed. Arrow heads indicate representative cells with strong colocalization. Three biological replicates were included in the experiment. Scale bar =20 µm. h Comparable Western blotting analysis of SOD3 expression in neutrophils sorted from uninfected or infected mice. SOD3 expression in neutrophils of infected mice was significantly more than that from uninfected mice. Three biological replicates were included in the experiment. Each experiment was repeated three times independently with similar results. The neutrophils illustration was created with http://BioRender.com (publishing license: TB26UIITUU). i Schematic representation of the procedure for adoptive transfer. The illustration was created with http://BioRender.com (publishing license: NC26UIHFCR). j Adoptive transfer of WT neutrophils into SOD3−/− mice resulted in early death of SOD3−/− mice after P. berghei ANKA infection. Five biological replicates were included in the analysis. Kaplan‒Meier survival curves were calculated using the survival time for each mouse in all groups, and significance was determined by the log-rank test. Histograms present the mean ± SD. Source data are provided as a Source Data file.

