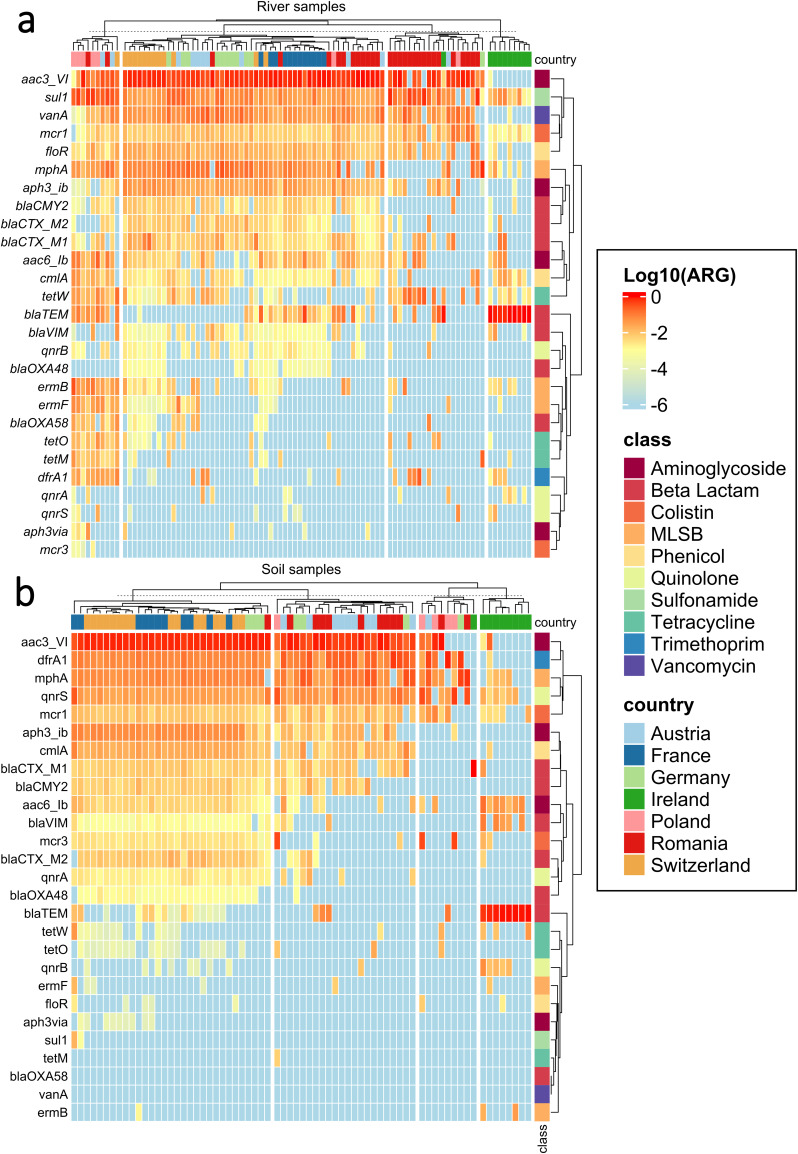
Fig. 2. Heatmap of relative ARG abundances.
(a) in the river dataset, (b) in the soil dataset. Values are displayed after transformation to log10 scale. The list of ARGs is presented based on similarity in abundance patterns and displayed from high abundance (red) to below the detection limit (blue). Color coding on the right displays the class of antibiotics they confer resistance to. Samples are ordered according to similarity in ARG profiles represented by the dendrogram on top based on default Euclidian clustering from the ComplexHeatmap R package79 and color coded based on country of origin.

