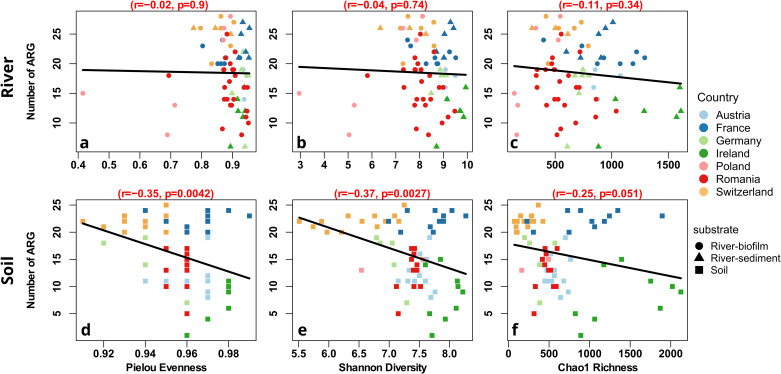
Fig. 3. Correlation analysis of the number of ARGs detected per sample with diversity metrics.
Linear Pearson correlation with Bonferroni correction for multiple testing from river environmental samples with Pielou Evenness (a), Shannon Diversity (b) and Chao1 Richness (c). Linear correlations from soil environmental samples with Pielou Evenness (d), Shannon Diversity (e) and Chao1 Richness (f). Colors depict the country of sample origin and the symbols depict the sample type.

