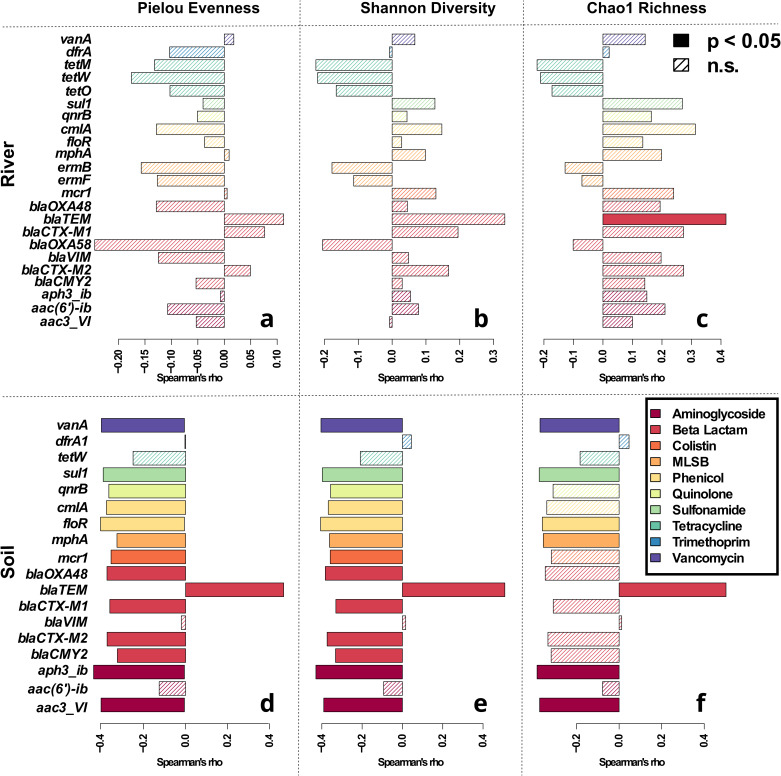
Fig. 4. Correlation analysis of relative ARG abundance with observed diversity metrics.
Spearman rank correlation with Bonferroni correction for multiple testing from river environmental samples with Pielou Evenness (a), Shannon Diversity (b) and Chao1 Richness (c). Correlations from soil environmental samples with Pielou Evenness (d), Shannon Diversity (e) and Chao1 Richness (f). Filled bars represent significant, while hatched bars represent non-significant correlations. Colors depict the class of antibiotic the ARG confers resistance to. Only ARGs that were detected in at least 25% of samples of a dataset were tested.

