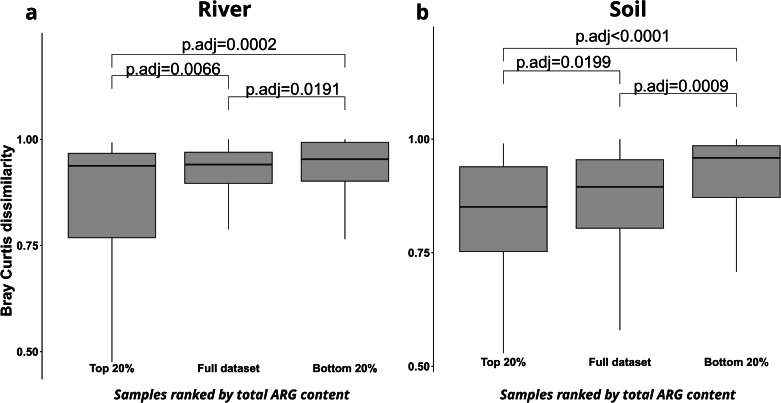
Fig. 6. Distribution of pairwise Bray-Curtis dissimilarities.
Distribution of pairwise Bray-Curtis dissimilarities for river (a) and soil (b) dataset is displayed across all samples within the dataset as well as across those subsets of samples with the 20% lowest (Bottom 20%) and the 20% highest (Top 20%) total ARG abundance. Significance testing between pairwise dissimilarity distributions is performed through one-way ANOVA with post-hoc Tukey HSD.

