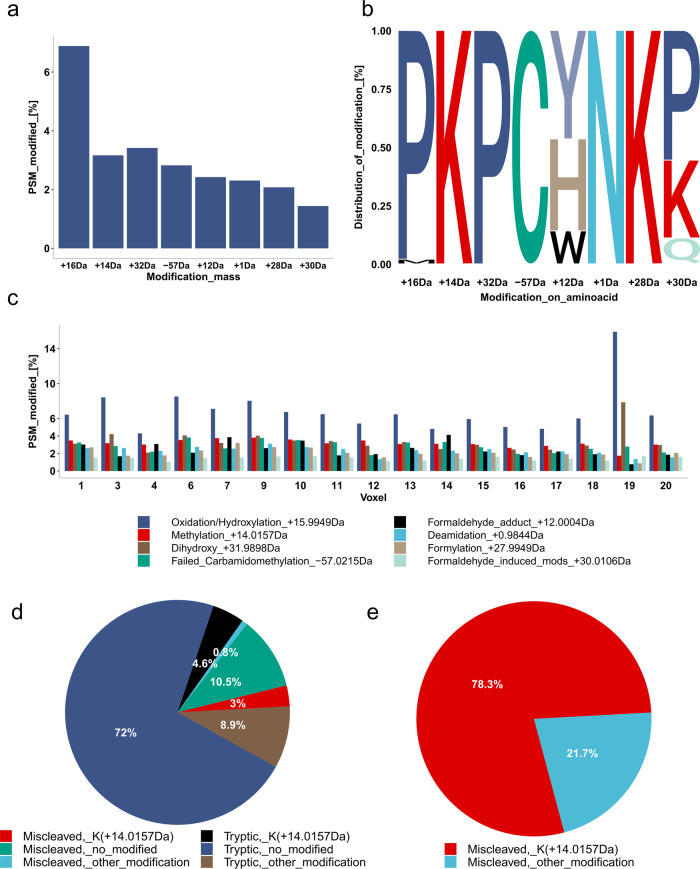
Fig. 4. Analysis of modification landscape in In-insert processed FFPE samples.
a Frequency of the 8 most abundant mass shifts expressed as a percentage of the total peptides identified. b Analysis of distribution of the 8 most abundant mass shifts among amino acids. The size of the letter abbreviation of the amino acid reflects the percentage of the total modified peptides that have the mass shift on the aminoacid. c Comparison of the frequency of the 8 most abundant mass shifts across 17 voxels expressed as a percentage of the total peptides identified. d Analysis of trypsin miscleavage with respect to lysine methylation, expressed as a percentage of total peptides. e Analysis of trypsin miscleavage with respect to lysine methylation, expressed as a percentage of modified and miscleaved peptides.

