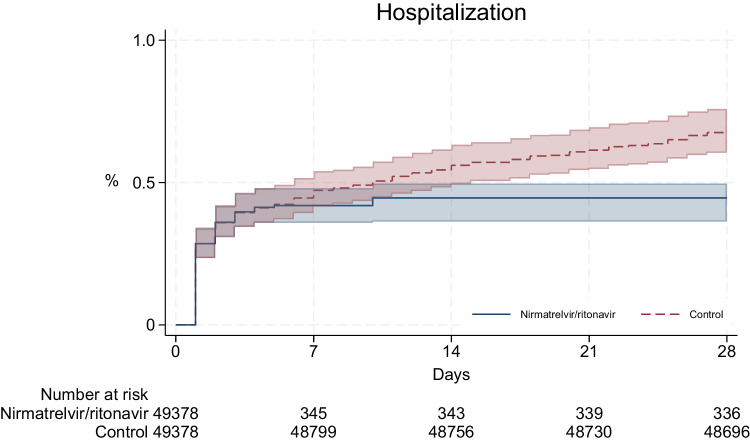
Fig. 2. Cumulative incidence of all-cause hospitalization in nirmatrelvir/ritonavir and control groups over the 28 days period.
Line plot represents the cumulative incidence of all-cause hospitalization in nirmatrelvir/ritonavir (blue line) and control groups (red line) over the 28 days follow-up period. Shaded regions represent 95% confidence bands calculated using 500 bootstrap replicates. Table represents number at risk in nirmatrelvir/ritonavir and control groups after cloning. Over 28 days of follow-up, the cumulative incidences of all-cause hospitalization were 0.45% and 0.68% among nirmatrelvir/ritonavir users and non-users, respectively.

