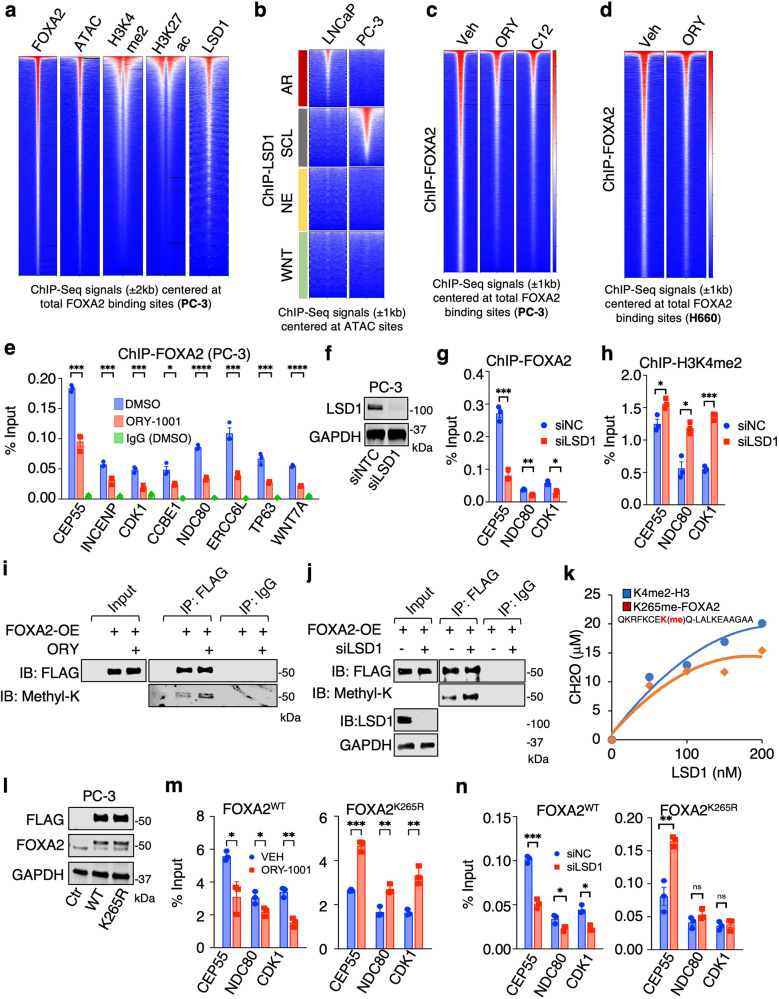
Fig. 3. FOXA2 chromatin binding is promoted by LSD1.
a Heatmap view for FOXA2, ATAC (Assay for Transposase-Accessible Chromatin using sequencing), H3K4me2, H3K27ac, and LSD1 ChIP-seq signal intensity at FOXA2 binding sites in PC-3 cells. b Heatmap view for the ChIP-seq signal of LSD129,61 centered at specific chromatin sites exhibiting different ATAC signatures. c Heatmap view of FOXA2 ChIP-seq signal in PC-3 cells treated with vehicle or LSD1 inhibitors, ORY-1001 (10 μM) or C12 (0.5 μM), for 4 h. d Heatmap view for FOXA2 signal in NCI-H660 cells treated with vehicle or ORY-1001(10 μM for 4 h). e ChIP-qPCR for FOXA2 binding at indicated FOXA2 target sites (n = 3 independent samples; data represented as mean ± SEM; statistical significance determined by unpaired two-sided t-test). f Immunoblotting for LSD1 in PC-3 cells transfected with siRNAs against non-target control (NTC) or LSD1 (n = 3 independent experiments). g, h ChIP-qPCR for FOXA2 binding (g) and H3K4me2 levels (h) at indicated FOXA2 target sites (n = 3 independent samples; data represented as mean ± SEM; statistical significance determined by unpaired two-sided t-test). i, j Immunoblotting for methyl-lysine on immunopurified proteins from FLAG-tagged FOXA2 expressing PC-3 cells treated with vehicle or ORY-1001(10 μM) for 24 h (i) or transfected with siNC or siLSD1 (j) (n = 3 independent experiments). k In vitro demethylation assay using synthetic H3K4me2 peptide (1–21 aa) or K265-methylated FOXA2 peptide (258-276aa) as substrates incubated with recombinant LSD1 proteins. l PC-3 cell lines stably expressing control vector, 3xFLAG-tagged FOXA2-WT, or 3xFLAG-tagged K265R mutant (FOXA2WT or FOXA2K265R cells) were established. Immunoblotting for indicated proteins in these stable lines (n = 3 independent experiments). m, n ChIP-qPCR for FLAG or FOXA2 binding at the target sites was performed in these stable cell lines treated with vehicle or ORY-1001(10 μM) for 4 h (m) or transfected with/out siLSD1 (n), respectively (n = 3 independent samples; data represented as mean ± SEM; statistical significance determined by unpaired two-sided t-test). ns (P > 0.05), *(0.01 < P < 0.05), **(0.001 < P < 0.01), ***(P < 0.001), and ****(P < 0.0001) were used to indicate the levels of P-value. Source data are provided as a Source Data file.

