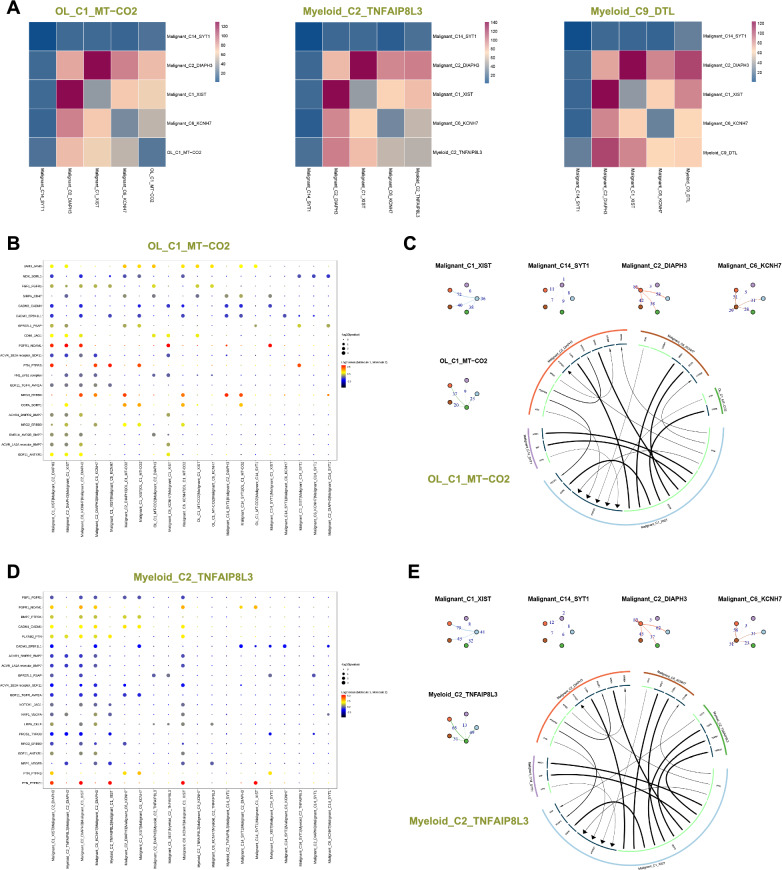
Fig. 8.
Intercellular communication. A Interactions heatmap between cell clusters, where the color gradient from blue to red represents an increasing number of interactions. B and D Interactions between two cell clusters via ligand-receptor pairs, where larger points indicate smaller p-values. The color gradient from dark gray to red represents the average expression level of ligand-receptor pairs from low to high. C and E Nodes represent cell clusters, nodes of the same color indicate the starting point, and reaching another node represents the endpoint. The numbers on the edges represent the number of ligand-receptor pairs, with thicker lines indicating more pairs (top left). The outer circle represents cell clusters, and the inner circle represents ligands or receptors. Arrows indicate direction, with the thickness of the lines representing the expression levels of the originating genes. The arrow size represents the expression levels of the recipient genes. Light green indicates the originating direction, while dark green represents the receiving direction (bottom right)

