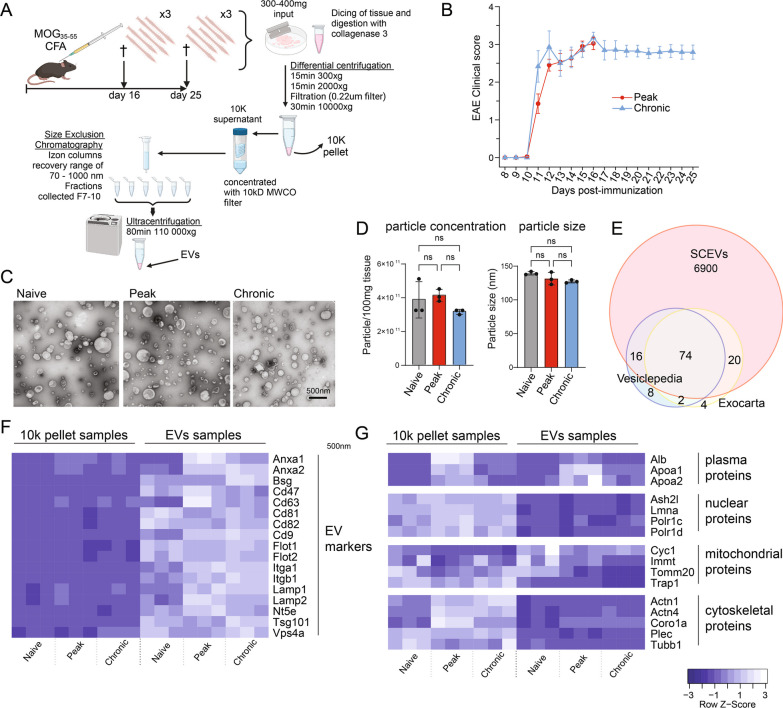
Fig. 1.
Workflow for spinal cord-derived EV separation and characterization. a The diagram depicting the EV separation method using size exclusion chromatography and ultracentrifugation (created using BioRender.com). b Clinical scores of mice at day 16 and day 25 showed no significant difference (n = 15 per time point). c Representative electron microscopy images of negatively stained EVs from spinal cords before EAE induction and at days 16 and 25 (ten images taken for three samples from each time point). d Particle concentration and size at the three time points obtained using NTA (bar graphs show the mean ± SD of n = 3 samples (pooled from 5 spinal cords) at each time point. Statistical significance was determined using one-way ANOVA and Turkey’s post-test. ns = not significant. e Number of the top 100 EV-enriched proteins, according to Vesiclepedia and Exocarta, present in the spinal cord EV proteome. f Heatmap showing the relative abundance of commonly used EV markers in spinal cord EV samples and 10k pellet samples (EV depleted particles) obtained as a byproduct of the EV isolation. g Heatmap showing the relative abundance of frequently described possible co-isolated proteins recovered from tissue during EV separation. (n = 3 for each time point and each sample type, i.e., EV and 10k)

