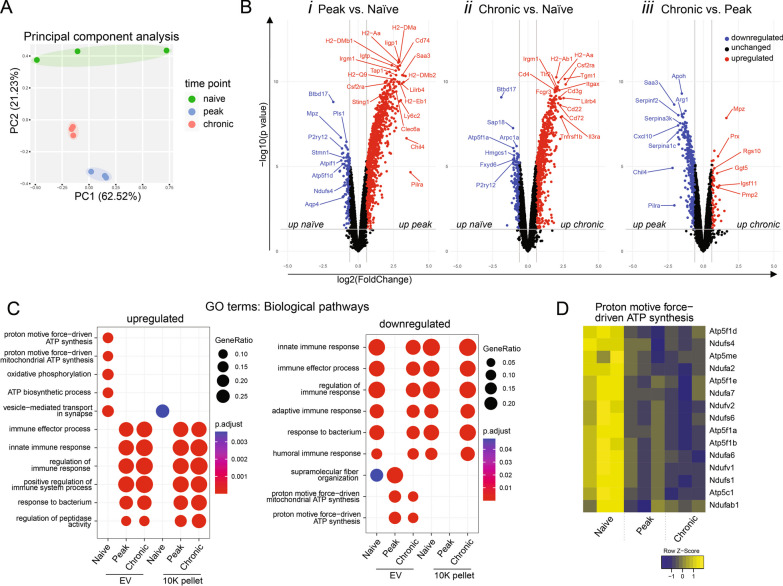
Fig. 2.
Proteomic changes in spinal cord EVs during EAE. a Principal component analysis using normalized abundances of proteins before EAE induction (green) and 16 (blue) and 25 (red) days after. b Volcano plots showing significantly up- (red) and downregulated (blue) proteins. Significance is defined by an adjusted p-value of < 0.05 and a < − 1.5 or > 1.5-fold change. Proteins are shown as gene symbols. c Dot plot of gene ontology pathway enrichment analysis showing the top upregulated and downregulated biological processes. The dot size represents the gene ratio, i.e., the identified proteins per gene set and the dot color represents the significance of the enrichment. d Heatmap showing the relative abundance of the proteins from the “proton motive force-driven ATP synthesis” GO term gene set. Proteins are shown as gene symbols [n = 3 (from 5 score-matched spinal cords) for each time point and each sample type, i.e., EV and 10k]

